Climate Impacts and Livelihoods

This workshop will introduce how people living in coastal Fiji use a range of coastal and terrestrial ecosystems to support their livelihoods. It will also demonstrate how these ecosystems are affected by a range of climatic stressors including severe tropical cyclones and seasonal hot and dry spells. Through their effects on the ecosystems people use, climate shocks exert a large impact on people’s livelihoods in this region.
In this workshop you will learn how to use causal loop diagrams to combine socio-economic, climatic, and environmental variables to understand how ecosystems support people’s livelihoods, how climate shocks affect these ecosystems, diagnose sources of vulnerability in livelihood systems, and design adaptation strategies and policies to boost system resilience.
Causal loop diagrams are a modelling tool used for:
- visualising system structures (i.e. the socio-economic and environmental variables comprising a livelihood system)
- identifying the mechanisms that generate system outputs (e.g. ecosystem services)
- exploring the effects of external factors such as climate shocks or policy interventions on the system
You will need a few sheets of blank paper, different coloured pens, a pencil, and an eraser to complete this workshop.
Ba Mangroves
This workshop will focus on the Ba Mangroves area in Northern Viti Levu, Fiji. People living in communities surrounding the Ba Mangroves rely on a range of ecosystems including mangroves to collect crabs, other marine life, and firewood; freshwater and ocean fishing; farming; and labouring on larger sugarcane farms.
Click on a marker to explore the ecosystems surrounding the Ba Mangroves.
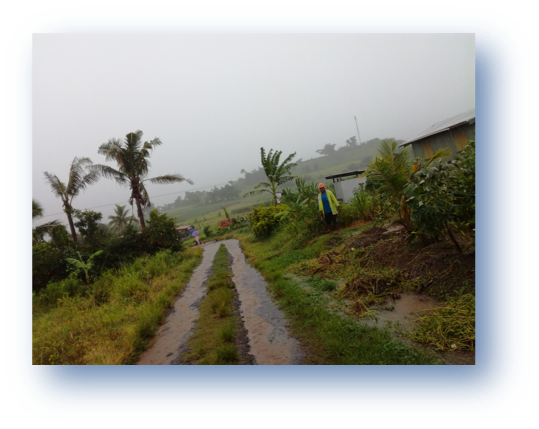
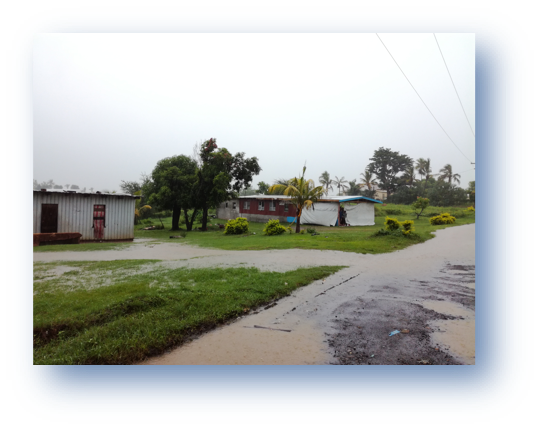
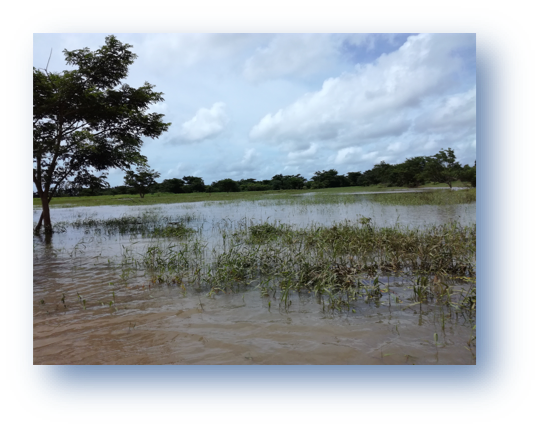
A range of climatic stressors affect these ecosystems. The strong winds and heavy rains of tropical cyclones damage mangroves and fruit trees, flood farms, and prevent people from fishing. The Ba region is also affected by flooding following heavy rain events which is exacerbated by land cover change in the upper reaches of the catchment. Following the cyclone season, the dry season brings dry spells, drought, and extreme heat events that affect crops and people when they’re working on the land or collecting marine life.
Learning Objectives
- Develop an understanding of how ecosystem services support livelihoods.
- Learn how to build a causal loop diagram to represent the structure and dynamics of livelihood systems dependent on ecosystems.
- Use the causal loop diagram to identify how climate impacts to ecosystems affect livelihoods.
- Use the causal loop diagram to design an adaptation strategy or policy to boost the resilience of livelihood systems to climatic shocks.
Concepts
System
Systems comprise a number of interacting variables and can be described by its structure (the relationships between variables) and functioning (the purpose of the system and what outputs it generates).
Variable
A variable is an entity that has a value and whose value can change. In this workshop we’re interested in climatic variables (e.g. tropical cyclone intensity), biophysical and environmental variables (e.g. mangrove area, crop production, fish populations), and socio-economic variables (e.g. household income).
Ecosystem
An ecosystem is an area comprising dynamic and complex interactions between plants, animals, microorganism communities and non-living factors. (MA, 2003). A mangrove forest is an example of an ecosystem comprising mangrove trees and various marine and nearshore animals.
Ecosystem Service
The benefits people obtain from ecosystems. The benefits can be products such as crops, fish, and timber or processes that regulate ecosystem functioning in ways that benefit people such as flood prototection provided by coastal forests or pollination services provided by bees (MA, 2003). Mangrove forests provide a range of ecosystem services including timber and food (fish and crabs), storm protection services, carbon sequestration, and regulation of sediment dynamics.
Socio-ecological System
Socio-ecological systems are complex, integrated systems comprising human systems and ecosystems.
Resilience
There are numerous definitions of resilience. Here, resilience is defined as the ability of a socio-ecological system to maintain provision of ecosystem services over time and in the face of climate shocks.
Activity 1: Ecosystems and Livelihoods
People living in and around the Ba Mangroves use a range of landscape resources and ecosystems to support their livelihoods. The Google Earth Tour accessed by clicking the button below will allow you to explore various coastal ecosystems, farms, and rivers that people use in Ba to generate food and income to support their livelihoods. Many of these ecosystems provide services other than products such as fish or crops but may provide climate regulation services (e.g. shade from trees). Look out for the range of ecosystem services people in Ba benefit from.
TASK: make a list of variables that comprise the landscape resources, ecosystem services, and economic variables that are important for supporting livelihoods in the Ba Mangrove region. For example, the start of your list might look like:
- mangroves (mud crabs)
- freshwater fishing
- ocean fishing
- cassava
- …
Activity 2: Climate Impacts
Work through the Google Earth Tour accessed by clicking the button below. This tour compiles a range of information collected through various field activities demonstrating how climate shocks affect landscape resources and ecosystem services in the Ba Mangrove region.
TASK: make a list of a climate shocks that affect each of the landscape components or ecosystem services that are important for supporting livelihoods (identified in Activity 1). For example, the start of your list might look like:
- tropical cyclone - cassava damage (reduced food in houshold)
- flooding - reduced fish catch (reduced income)
- heat / drought - crop damage (reduced food in household / wage labour income)
- …
Activity 3: Responding to Climate Shocks
When climate shocks affect landscape resources and ecosystem service flows in the Ba Mangrove region people deploy various response strategies to compensate for these impacts, secure income and food, and recover affected resources. Use the Google Earth Tour below to explore some of the response strategies deployed by people living in the Ba Mangrove region.
TASK: for each climate shock that you identified in Activity 2 identify a response strategy that people have deployed. Make a list of these response strategies. For example, the start of your list might look like:
- heat / drought impacts to vegetables - use coconut palms as shade
- tropical cyclones reduce mud crab collections - walk further afield to collect crabs
- tropical cyclones impact fishing - take jobs in town to compensate lost income
- …
Causal Loop Diagrams
You have been presented with lots of information: the variety of climate impacts to ecosystems in the Ba region, the numerous ways people use ecosystems to support their livelihoods, and the different response and adaptation strategies people deploy to cope when climate impacts occur. This data is unstructured and unwieldy. This makes it hard to analyse and use in addressing important questions such as who is vulnerable to climate impacts? and, what adpatation strategies will be most effective?
To synthesise complex and unstructured data, researchers use causal loop diagrams. Causal loop diagrams are models that make explicit cause-effect relationships and feedbacks between climatic, environmental, and human components in a socio-ecological system. The diagrams provide a clear way to visualise the structure of the system and identify how links between system variables combine to affect outcomes (such as the impact of a climate event on someone’s livelihood).
Let’s build a simple causal loop diagram to illustrate how they work:
Identify the problem variable
The first stage in building a causal loop diagram is picking a problem or focus variable. Typically, a problem variable should be something that relates to someone’s well-being; an increase or decrease in the problem variable should cause a change in their well-being. Often, we’re looking to design strategies or policies that affect problem variables to boost people’s well-being or protect them from climate shocks or other harmful stressors. In this example, let’s focus on collecting crabs from the mangroves. Mud crabs collected from the Ba Mangroves are sold in the local markets, which is an important source of income for many households.
Identify the causes of the problem
After we have identified the problem variable, we need to identify causes. Causes affect the problem variable and the presence of a cause can result in an increase or decrease in the problem variable. Debris in small streams and channels in the mangroves can prevent people from accessing areas to collect mud crabs; thus, an increase in debris causes a decrease in mud crab collections. Debris in small streams and channels is our cause. As levels of debris directly affects people’s ability to collect crabs, we say it is a direct cause.

However, something else causes debris to build up in small streams and channels. Variables that cause a build up or decrease in debris are indirect causes of change in collections of mud crabs from the mangroves. They’re indirect causes as they affect mud crab collections through another variable (the direct cause). In this example, a tropical cyclone is an indirect cause as the high winds associated with the storm can damage mangrove trees with fallen branches and trunks blocking streams.

Tropical cyclones can also directly affect levels of mud crabs in the mangroves. The high winds and flooding associated with the storm can reduce numbers of mud crabs in the mangroves which directly affects the amount people can collect. Tropical cyclones are a direct and indirect cause of levels of mud crabs available for people to collect. This is an early example of how causal loop diagrams can capture complex linkages between components of a socio-ecological system.

Identify the consequences of the problem
A consequence is a result of a change in the problem variable. As tropical cyclones cause a decrease in mud crab collections, people need to respond to secure food and income. If debris is blocking people’s preferred locations to collect mud crabs they collect crabs at locations that are more accessible near their home. Changing location for collecting mud crabs is a direct consequence.

However, these more accessible locations for collecting mud crabs are not the best locations to collect crabs. This means people’s catch is reduced and they need to find other ways to generate income. People do this by working as wage labourers on sugarcane fields. There are two things to note here. The first is that collecting crabs in sub-optimal locations links back to the problem variable of reducing levels of people’s mud crab catch. The second is that tropical cyclone’s causing a change in the problem variable, mud crab collections, causes people to collect crabs in sub-optimal locations which reduces food and income. To compensate for this, people take on new income generating activities and work as wage labourers on sugarcane farms. This is an indirect consequence of tropical cyclones impacting mud crab collections.

We have mentioned that people collect crabs to generate income; this is another direct consequence of collecting mud crabs. It is also a direct consequence of collecting mud crabs in other locations and wage labour activities on sugarcane farms. We can see that as mud collections decrease people will have less household income (i.e. they have fewer crabs to sell at the market). This, in turn, has a knock-on effect on people’s household savings. If they have less income they will have less money to put into savings and they may need to draw on their savings to make up the shortfall. Change in people’s savings is an indirect consequence of tropical cyclones affecting mud crab collections.

Defining links between variables
We have started to create a system that describes how a tropical cyclone impacts people’s capacity to collect crabs, which, in turn, affects other livelihood activities and their income. Cause-effect links between variables in the system are already shown on the diagram, what is missing is a description of the type of cause-effect link which is important for understanding the dynamics of a system and how the effects of a cause (e.g. a tropical cyclone) propagate through the system affecting people and ecosystems.
Before we describe the links, there is one obvious link that is missing on our diagram. Tropical cyclones can affect sugarcane fields through flooding and waterlogging, which will also reduce sugarcane income.

There are two types of links between variables in a causal loop diagram:
- positive links - the causal and affected variable change in the same direction. If the cause increases then the affected variable increases. If the cause decreases then the affected variable decreases. For example, an increase in crab collections causes an increase in income.
- negative links - the causal and affected variable change in opposite directions. If the cause increases then the affected variable decreases. If the cause decreases then the affected variable increases. For example, an increase in tropical cyclone intensity or occurrence causes a decrease in mud crab collections.
Let’s add + or - signs to the links on the diagram to denote positive or negative links between system variables.

We have not described the link between tropical cyclones and collecting mud crabs, is this a positive or negative link?
negative link - as tropical cyclone occurrence or intensity increases mud crab collections decrease.
Why is the link between collecting mud crabs and collecting crabs in new locations negative?
As mud crab collections in people's preferred location decrease they start collecting mud crabs in new locations to offset the shortfall.
Why is the link between collecting crabs in new locations and collecting mud crabs negative?
As people increase collecting mud crabs in new locations (that are sub-optimal) levels of mud crab collections decrease. This could be due to there being less mud crabs available in the new locations or pressure on the resource reducing crab populations.
Why is the link between collecting mud crabs and household income positive?
As mud crab collections increase they can sell more crabs and increase their income.
Feedback loops
When links between variables form circles, feedback loops form in the system depicted in the causal loop diagram. There are two types of feedback loops:
- reinforcing loop: this occurs when a change in a causal variable propagates through the system to reinforce the initial change in the cause. For example, reinforcing loops occur when two positive links or two negative links form a loop.
- balancing loop: this occurs when a change in a causal variable propagates through the system and causing an opposite change in the initial cause. For example, balancing loops occur when one negative and one positive links form a loop.
There’s one loop in our simple causal loop diagram describing the mud crab collection system. The loop is formed by the two negative links between collecting mud crabs and collecting mud crabs in new locations. An increase in mud crab collections causes a decrease in collecting mud crabs in new locations. This decrease in collecting mud crabs in new (sub-optimal) locations results in an increase in mud crab collections. This, in turn, means people don’t need to collect mud crabs in a new location. And so on. This is a reinforcing feedback loop. However, we can see how a tropical cyclone can change the system dynamics and create reinforcing feedback loop of decreasing mud crab collections. A tropical cyclone reduces mud crab collections, which causes people to collect mud crabs in sub-optimal locations, which reduces mud crab collections, which causes people to continue collecting mud crabs in other sub-optimal locations, and so on.
Causal loop diagrams can provide a deeper and more complete understanding of the impact of external shocks, such as a climatic event or a policy intervention, by highlighting how their effects are amplified or attenuated by feedback loops. Identifying the presence of these feedback loops can highlight how resilient a system is to climate shocks and illustrate unforeseen consequences of policy interventions or adaptation strategies.
Activity 4: Causal Loop Diagrams
Following the tasks below, you will create a causal loop diagram that depicts how a problem variable affects poeple’s livelihoods. You will then use this causal loop diagram to undertake two analyses:
- Identify the cause-effect chains that explain how climatic shocks affect the problem variable, ecosystem services, and, subsequently, people’s livelihoods.
- Use the causal loop diagram to design an adaptation strategy or policy that reduces the negative impacts of climate shocks affecting your problem variable.
TASK 1: Select a problem variable
In Activity 1 you made a list of landscape resources and ecosystem services that people use to support their livelihoods. Pick one of the items on this list as a problem variable. Think carefully about how you select this variable. The goal of this task is to use a causal loop diagram to design an adaptation strategy or policy that reduces climate impacts on livelihoods. You should look to select a variable that is a landscape resource or ecosystem service which is important for someone’s livelihood and is sensitive to climate shocks.
In the middle of a sheet of paper write down your problem variable.
TASK 2: Identify causes
In Activity 2 you made a list of climatic variables that affect landscape resources and ecosystem services. Identify the climate variables that directly cause changes in your problem variable (i.e. the climatic variable does NOT cause a a change in the problem variable indirectly through another variable). If crop production is your problem variable, an example of direct climate causes could be flooding or heat events damaging crops in fields.
Use a different coloured pen, and to the left of your problem variable, write down the direct climate causes on your sheet of paper. Draw arrows that link climate causes to the problem variable.
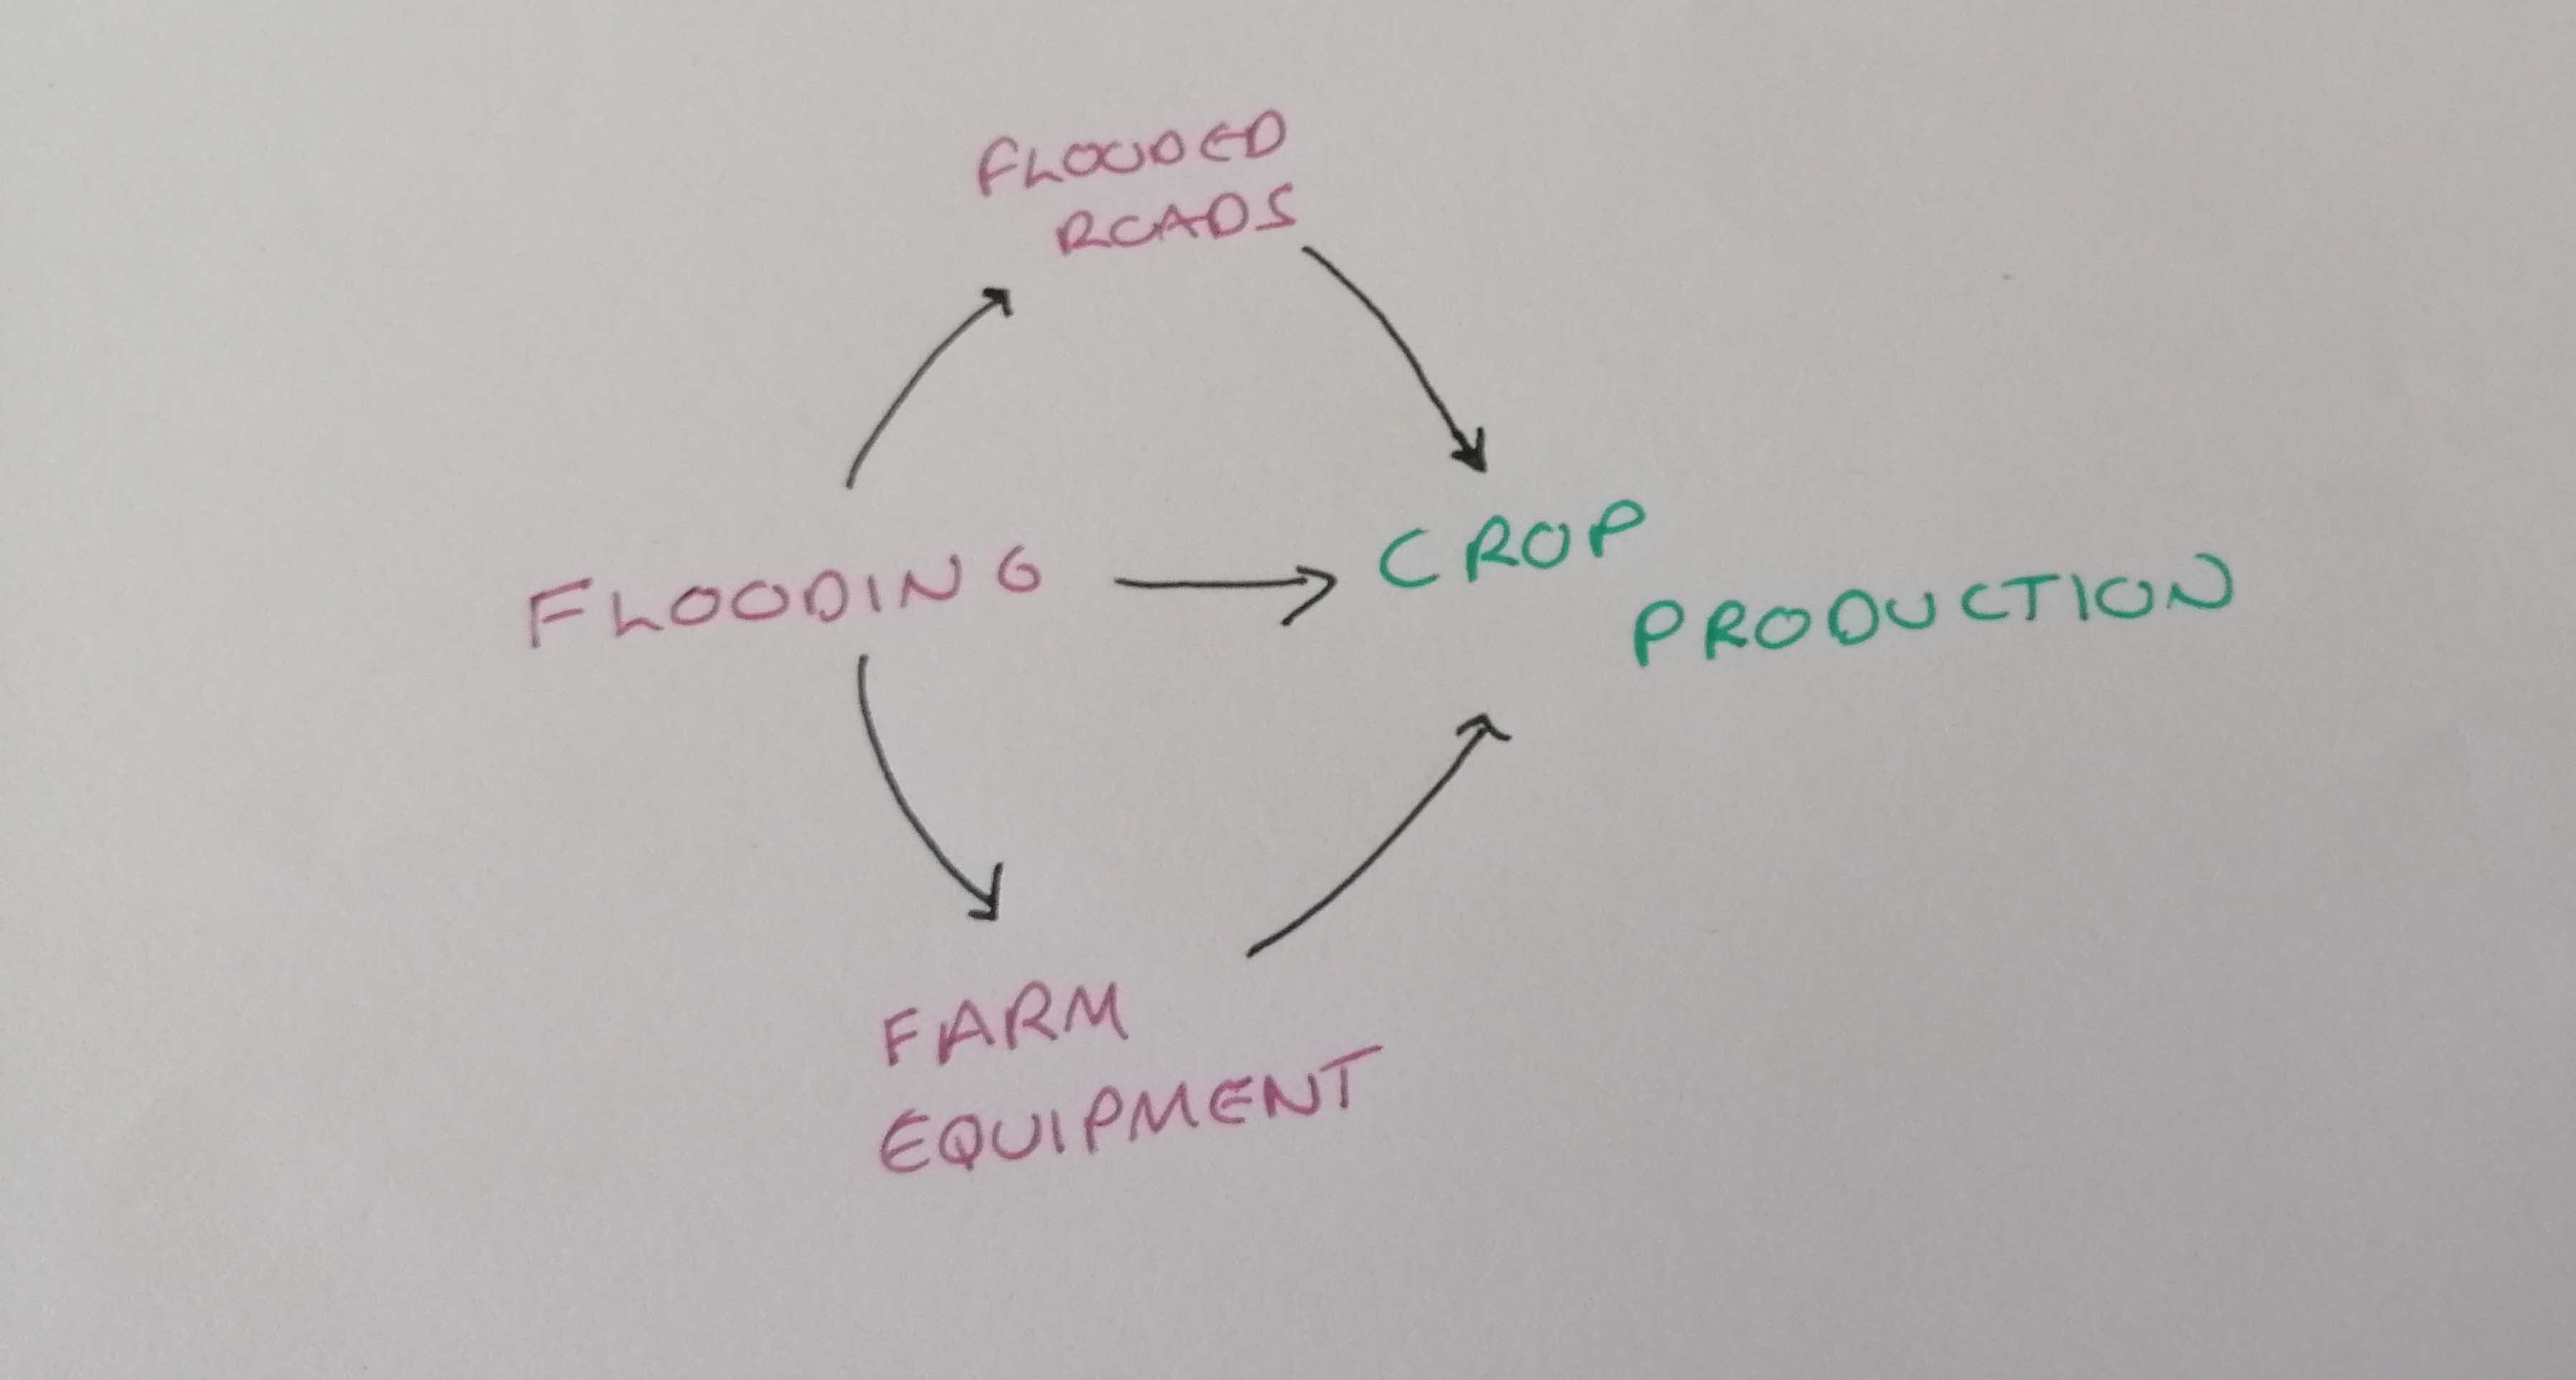
It is possible that climate shocks can indirectly affect your problem variable. Look at the notes you made in Activity 1 and Activity 2 to see if you can spot cases where a climate event causes a change in another variable, and the change in that variable causes a change in your problem variable. These are cases when climate variables are indirect causes. An example could be flooding damaging farm machinery or roads which makes it harder to harvest crops, which impacts crop production.
Staying on the left side of your diagram, add these causal chains where climate events are indirect causes. Draw arrows that link climate causes indirectly to the problem variable.
TASK 3: Identify consequences
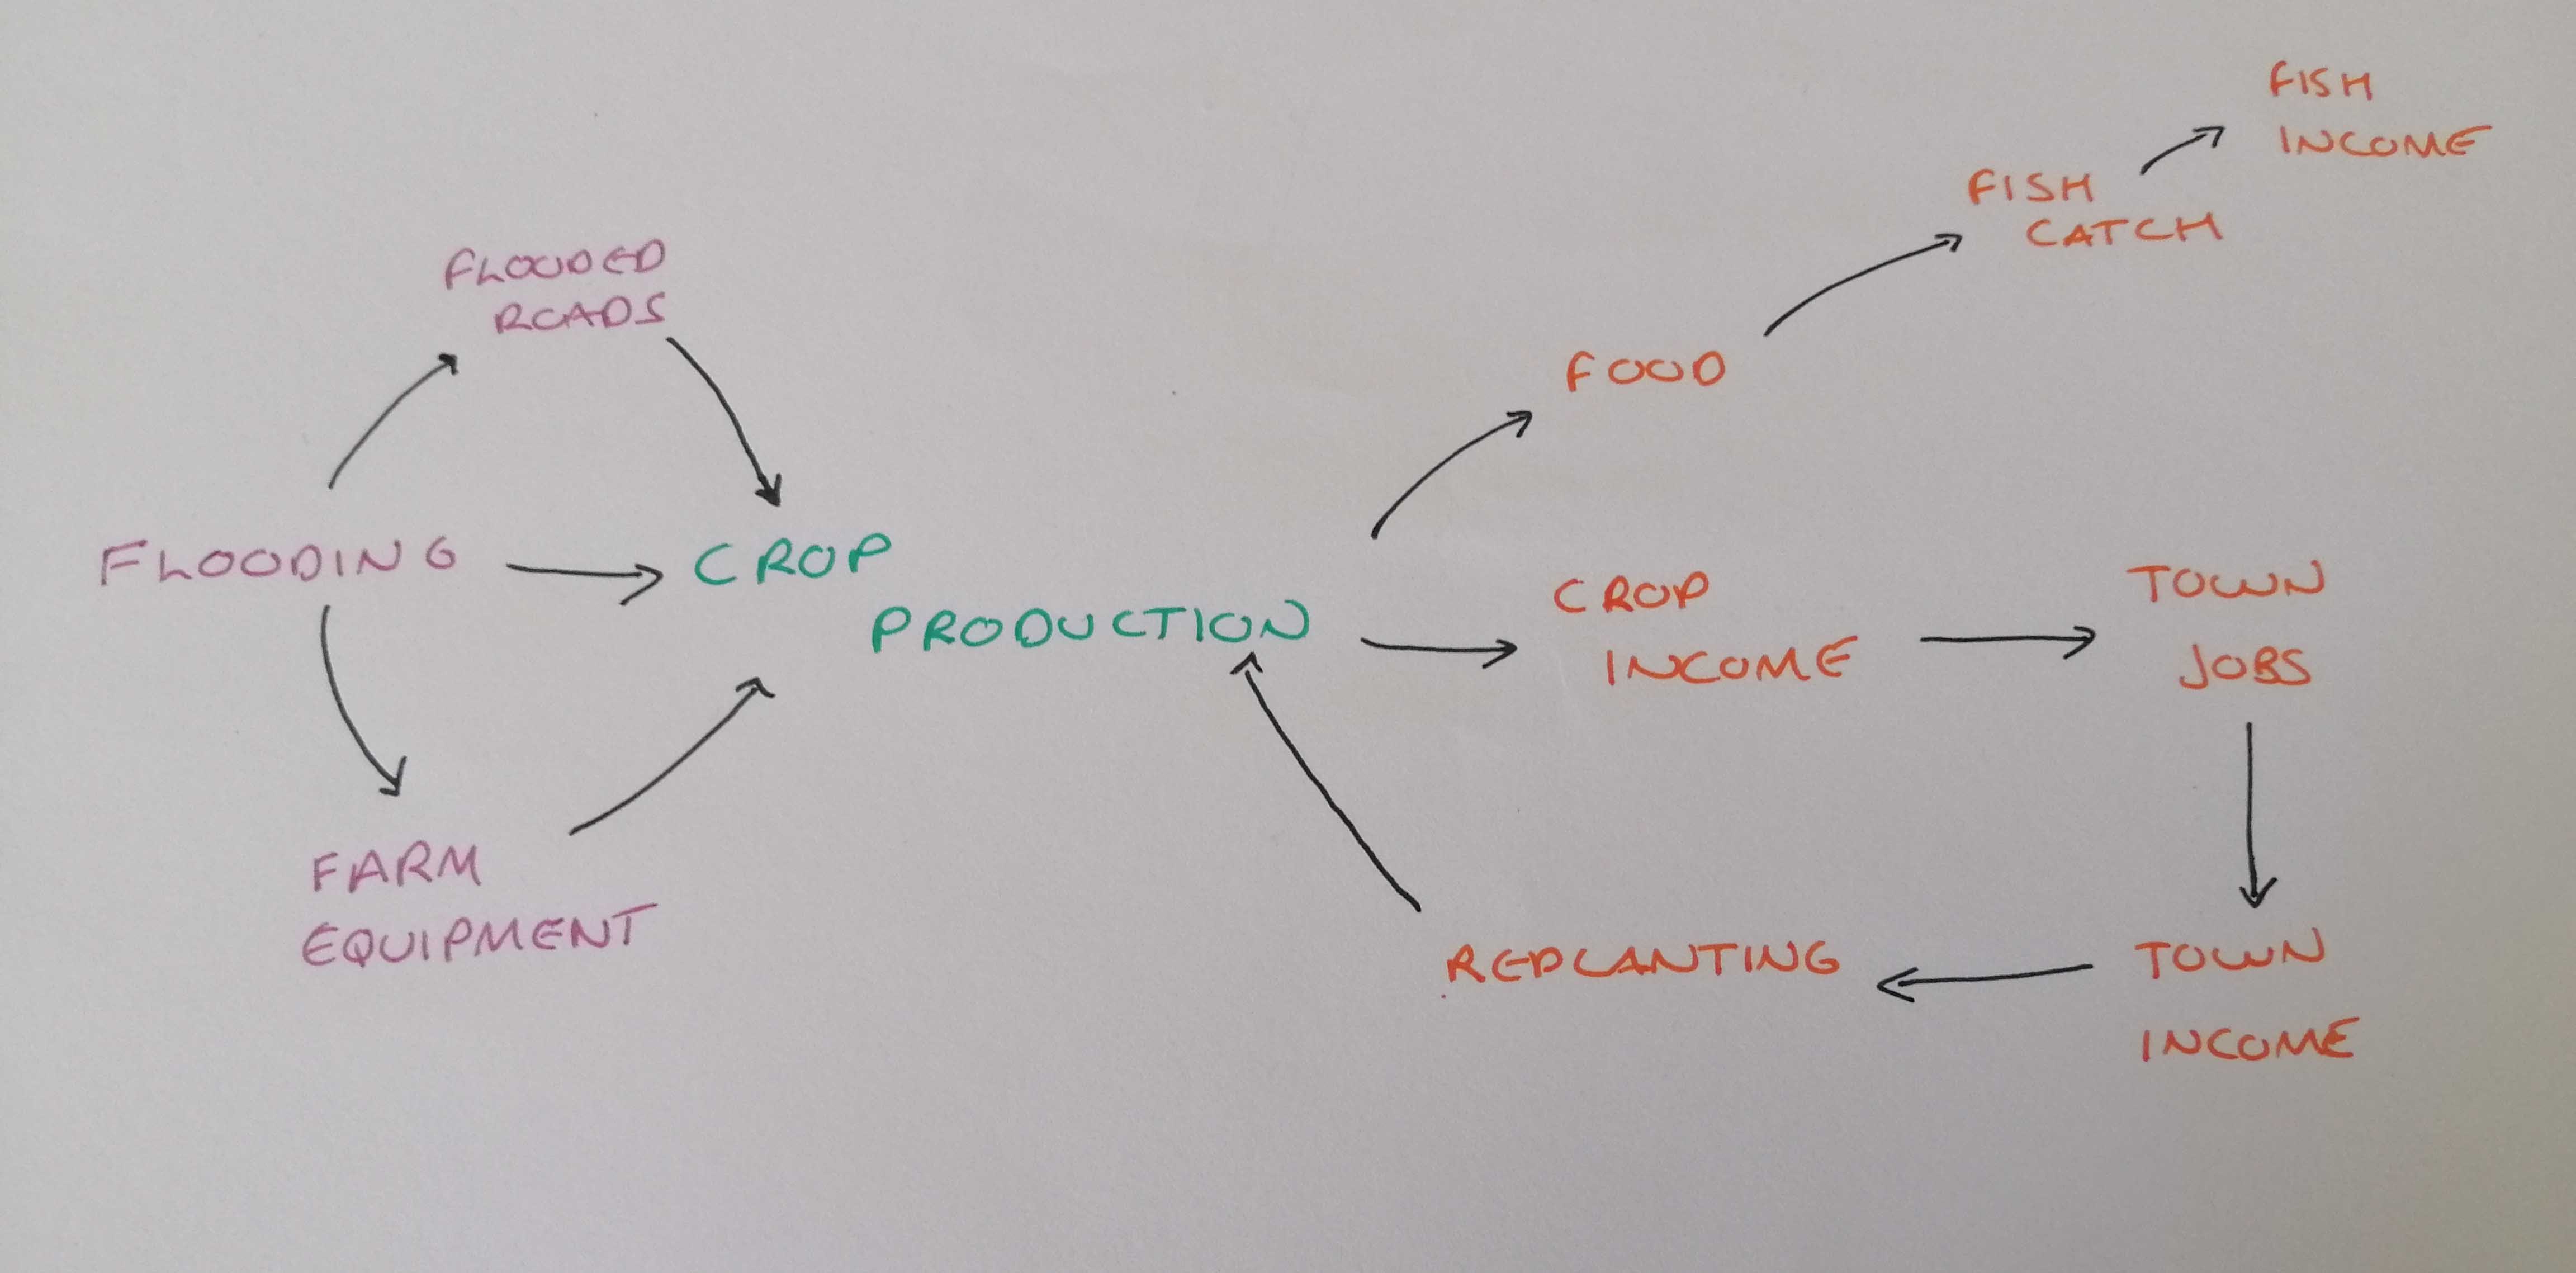
Next, we need to identify the consequences of the problem variable. There might be some obvious consequences (e.g. a decrease in crop production will result in less food for consumption or income generation). Make a note of any obvious consequences.
Another way to identify consequences of the problem variable is to identify other variables that are affected by the problem variable. Which of the variables that you identified in Activity 1 is your chosen problem variable a direct or indirect cause of? Add these to your list of consequences.
In Activity 3 you made a list of strategies people deployed to respond to climatic shocks. Check this list to see if any of these strategies were in response to climate shocks to your problem variable. Add these to your list of consequences.
Using a different coloured pen to your causes and problem variable, write down the consequences on the right side of your sheet of paper. Draw arrows that link the problem variable to the consequences.
TASK 4: Check for completeness
Reviewing the notes you made in Activities 1, 2, and 3 check that your causal loop diagram is complete. Ensure you have captured all the direct and indirect causes that affect the problem variable. Ensure that you have captured all the direct and indirect consequences of a change in the problem variable. It is likely at this step that you will spot several indirect consequences (e.g. a change in crop production affects sales of crops, this, in turn, causes people to increase fishing activities or take on jobs in town).
Capturing all the indirect consequences of a climate shock to your problem variable is important to i) fully understand how people’s livelihoods are affected, and ii) to assess the resilience of the sytem in terms of its capacity to provide ecosystem services.
TASK 5: Describe links
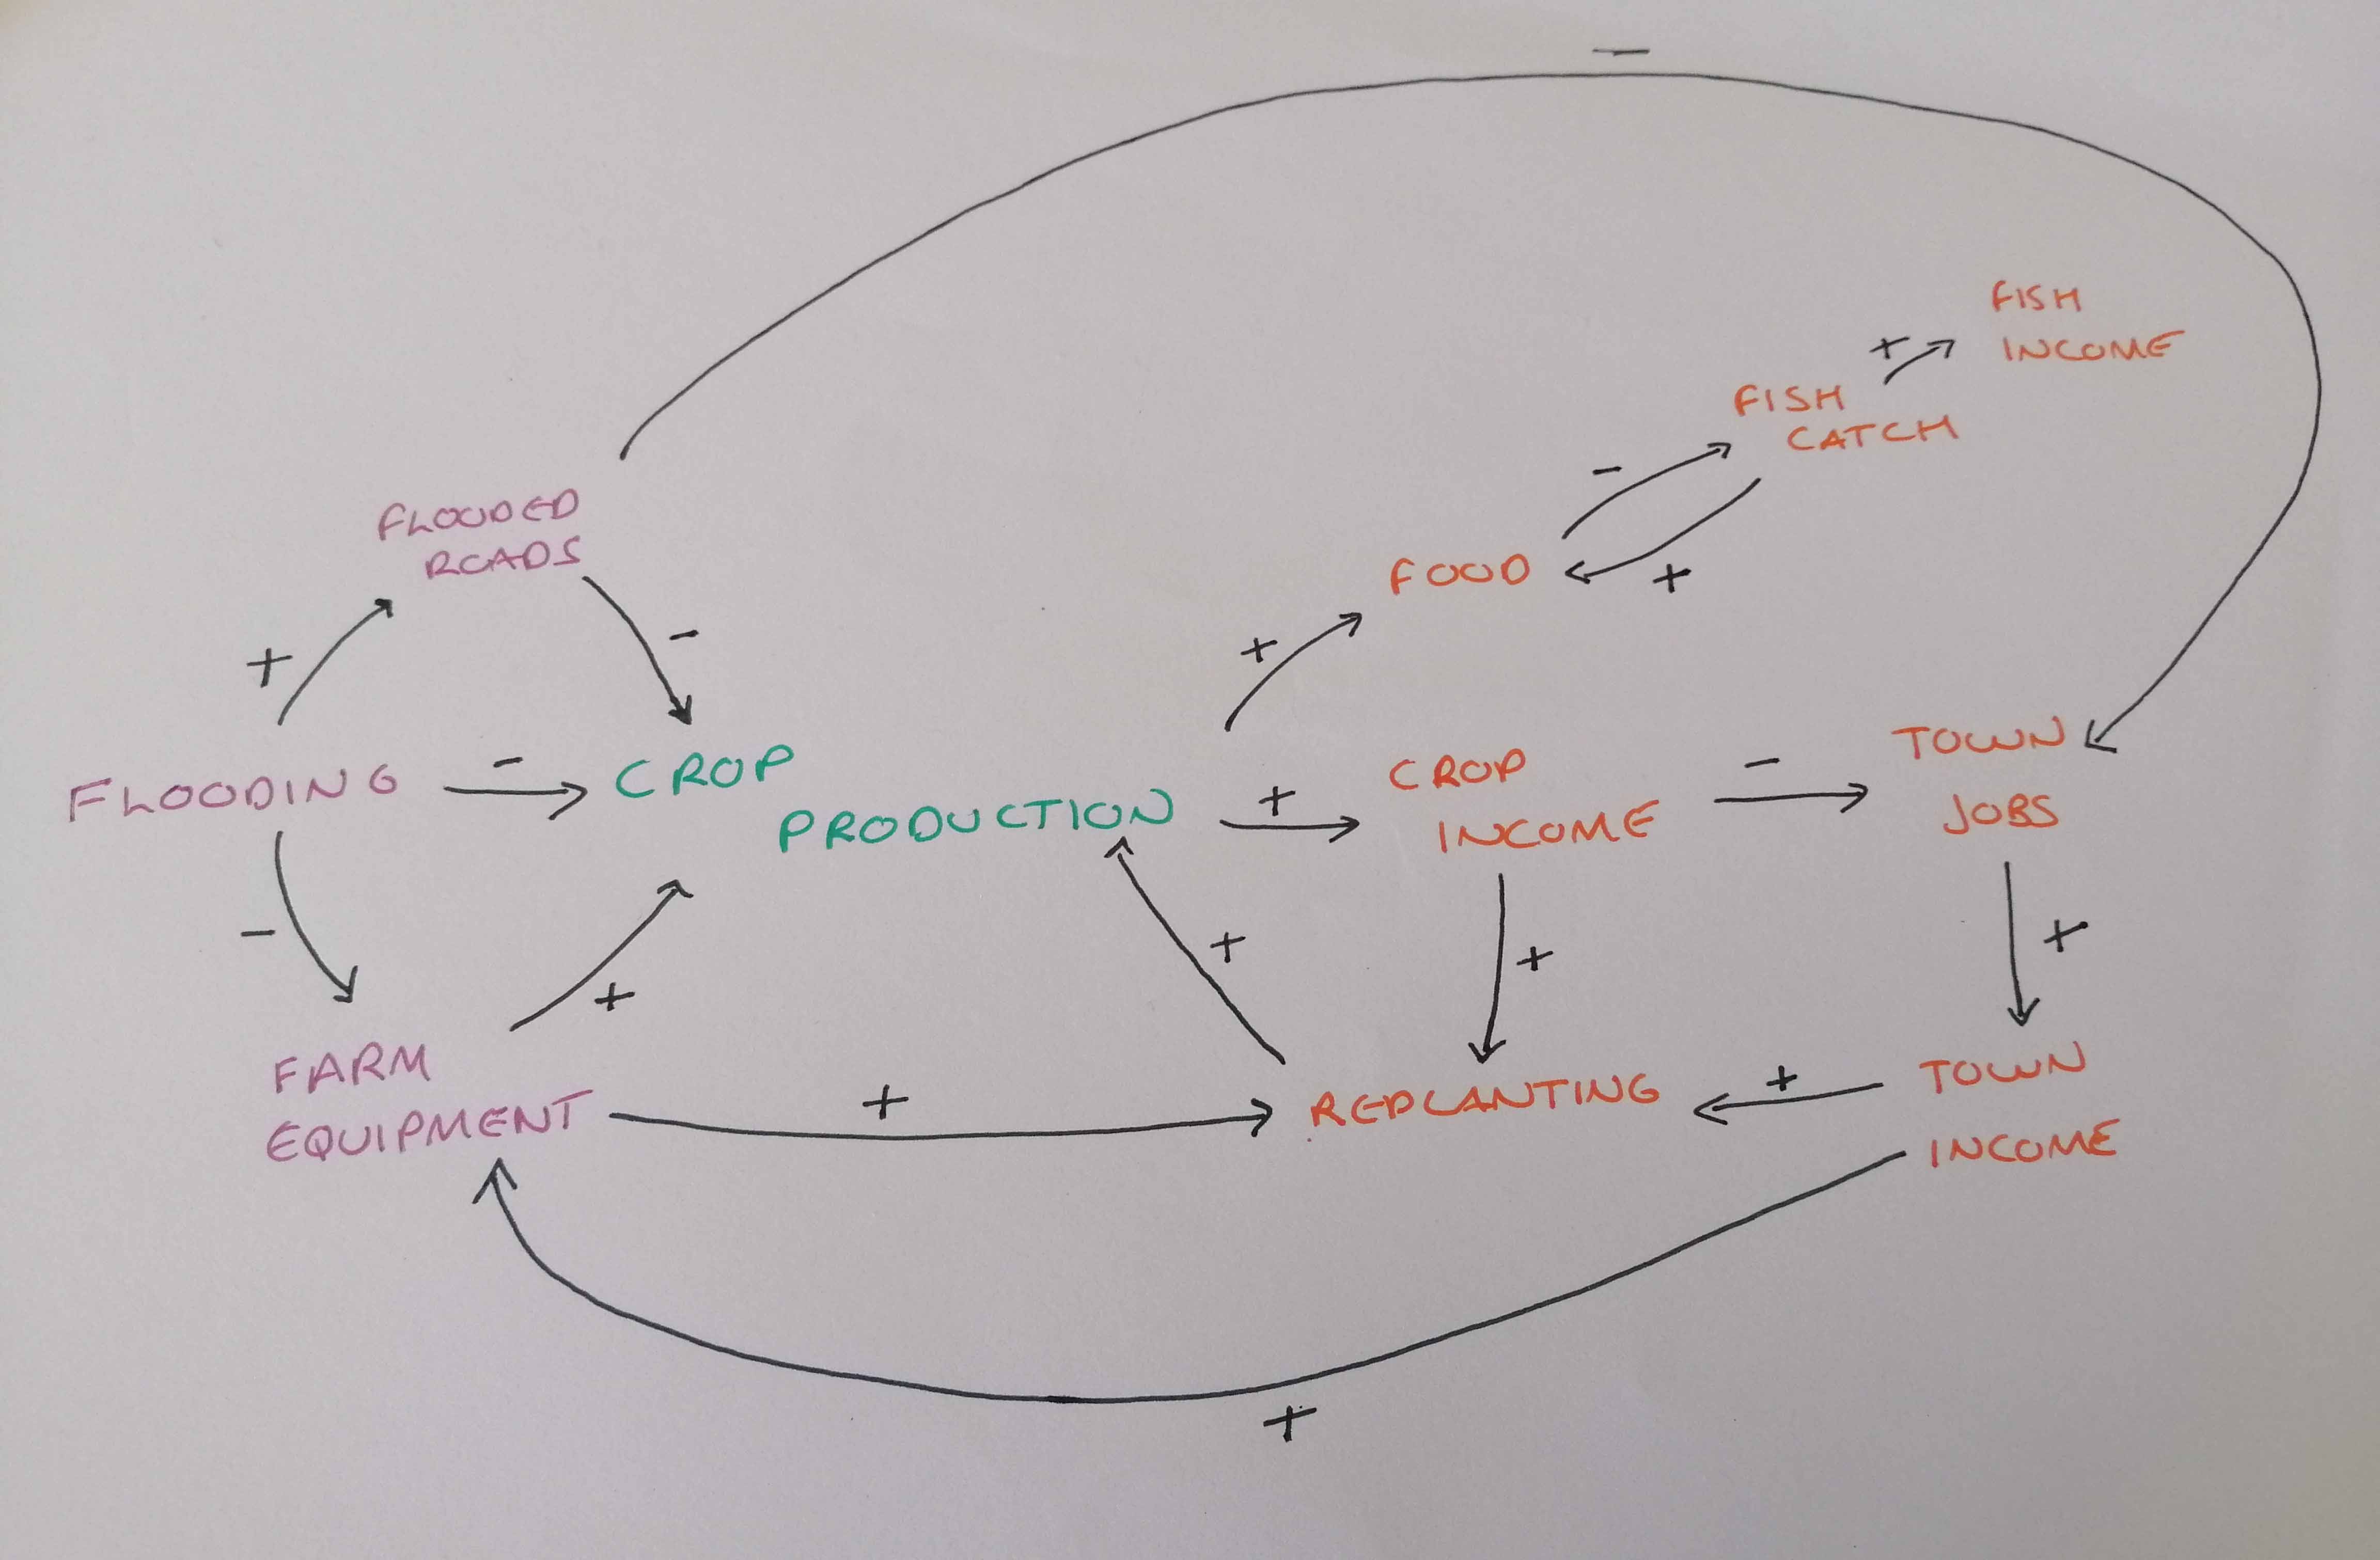
You should now have a detailed causal loop diagram depicting the direct and indirect causal chains showing how climate events affect your problem variable and chains of consequences showing how people are affected and respond. The next stage is to describe the links between the variables on your diagram.
Add a + sign next to all positive links and a - sign next to all negative links.
TASK 6: Identify feedbacks
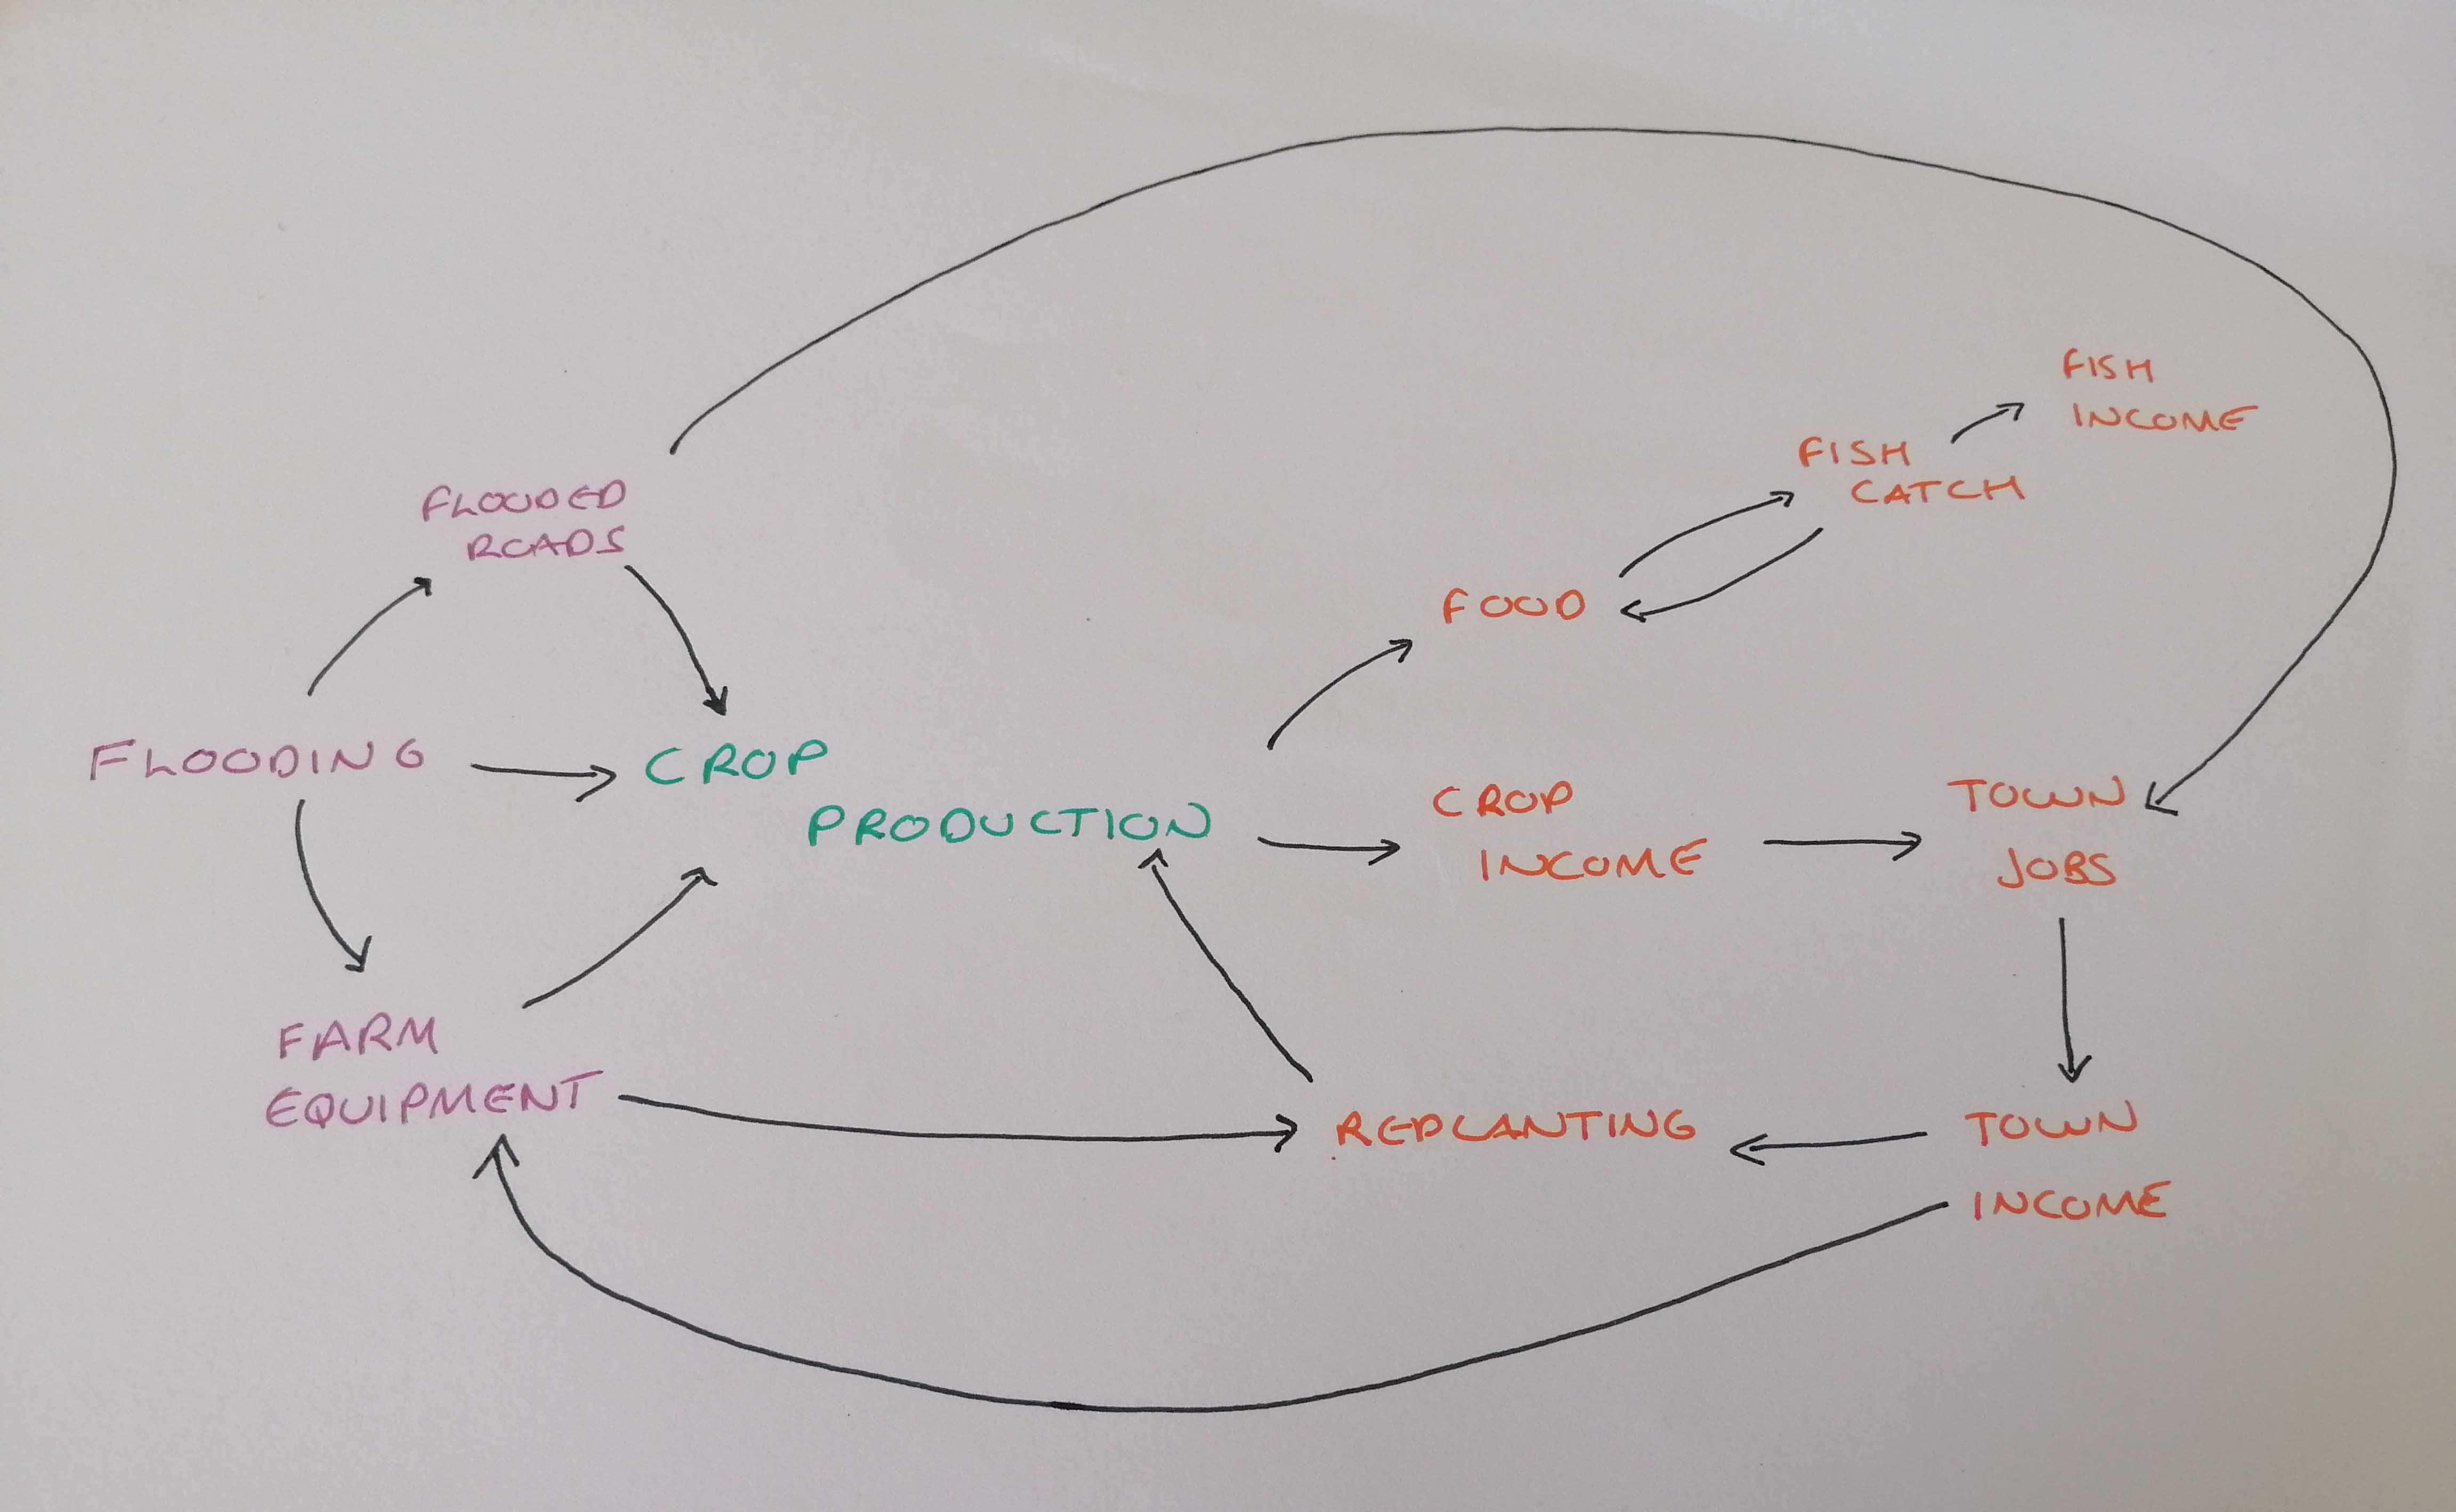
Work through your causal loop diagram to identify any feedback loops which link together causes and consequences. Feedback loops can involve two or more variables and can occur between causes and consequences of your problem variable, direct and indirect causes of your problem variable, and direct and indirect consequences of your problem variable. Make a note of whether a feedback loop is reinforcing or balancing. Label each of the feedback loops as reinforcing (R) or balancing (B).
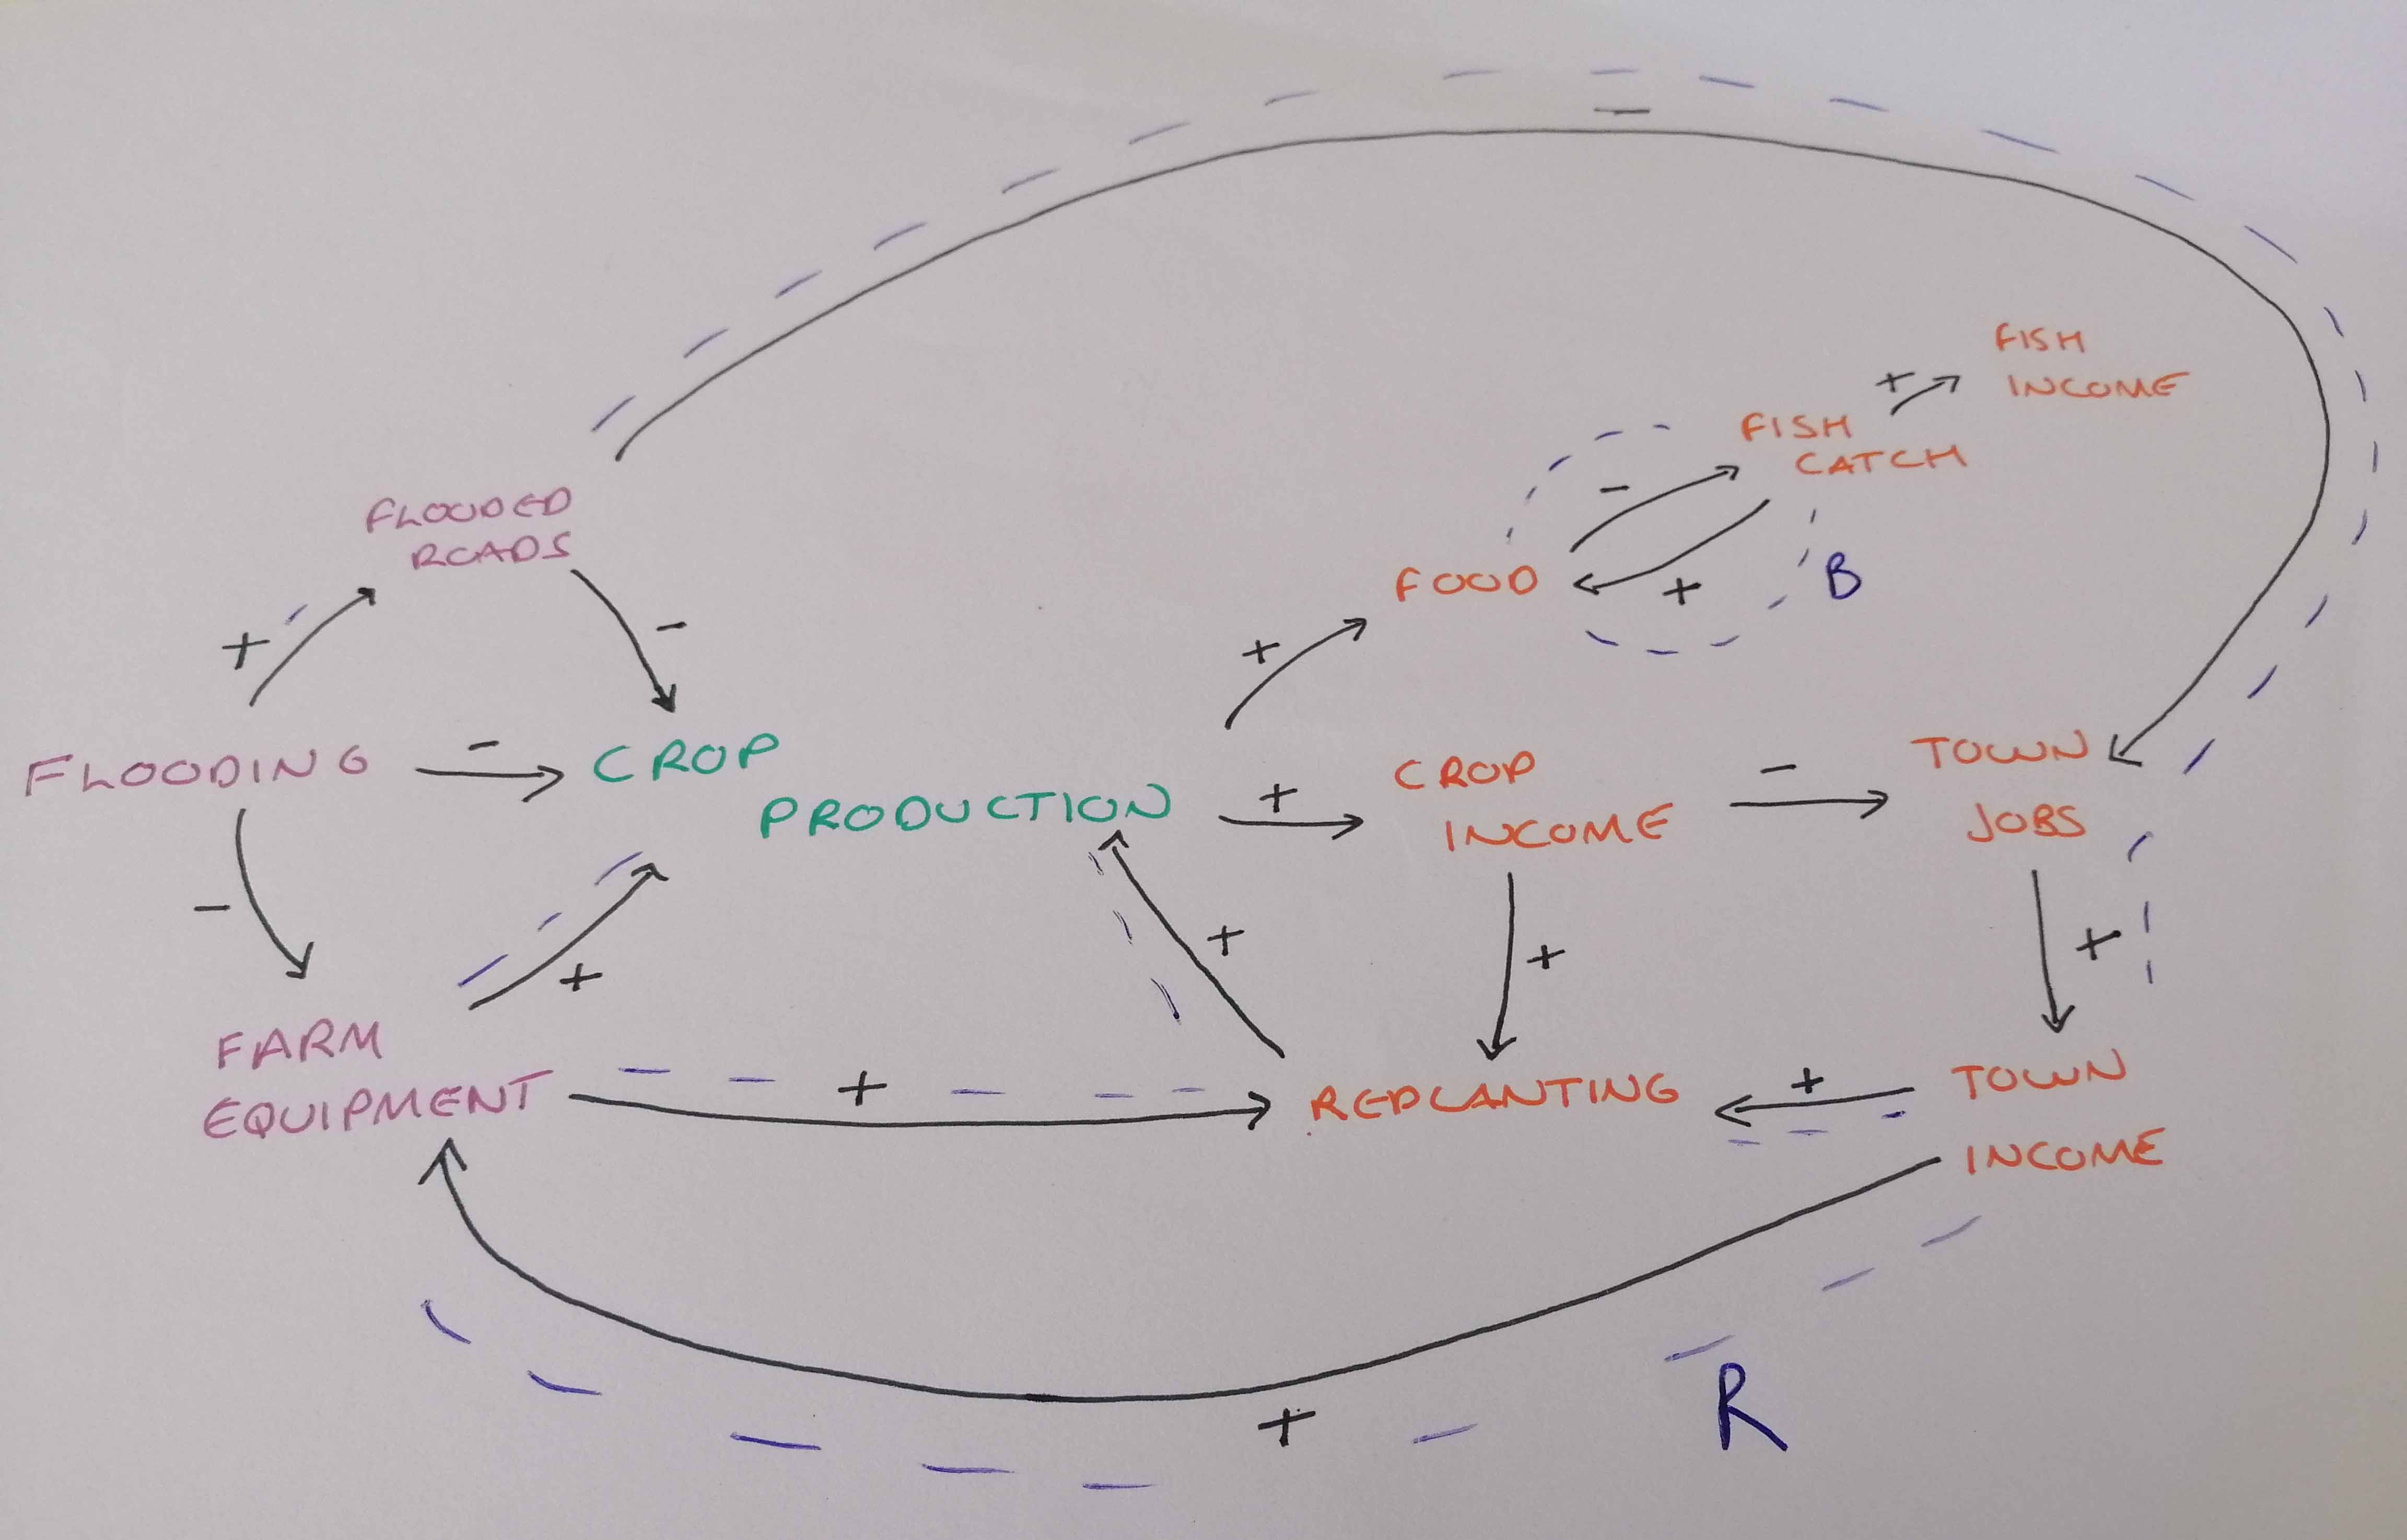
Two feedback loops have been labelled. The first is a small balancing loop between fish catch and food. The second is a larger more complex feedback loop which shows how flooded roads prevent people working in towns through restricted access, which prevents people from generating an income, which prevents people from repairing farm equipment, which prevents people from replanting, which further impacts crop production. This is a reinforcing loop; the loop is reinforcing the negative impacts of flooding on crop production.
TASK 7: Identify climate shocks and their impacts
Now your causal loop diagram is ready to be used for anlaysis tasks.
Let’s use the diagram to analyse the different ways that climate shocks impact livelihoods. In particular, think about the ways that climate events indirectly and directly affect ecosystem services that people use to support their livelihoods. Use you diagram to answer the following questions.
- What are the different causal chains that describe how climate shocks impact livelihoods? Highlight these causal chains on your diagram and identify the ecosystem service that is affected.
- Are these climate impacts on livelhoods short-term and long-term? Label each causal chain as a short-term, long-term, or both short- and long-term impact.
- Are the causal chains you’ve identified part of feedback loops which reinforce (amplify) or balance (reduce) climate impacts on livelihoods? Label each of the feedback loops as reinforcing (R) or balancing (B).
A resilient system is able to keep providing ecosystem services that people need to support their livelihoods.
- Do the feedback loops in your causal loop diagram interect with climate shock to to reduce the system’s capacity to provide ecosystem services over time (low resilience) or quickly recover from the shock and maintain ecosystem service flows (high resilience)? Label each of the feedback loops as low-resilience (LR) or high-resilience (HR)
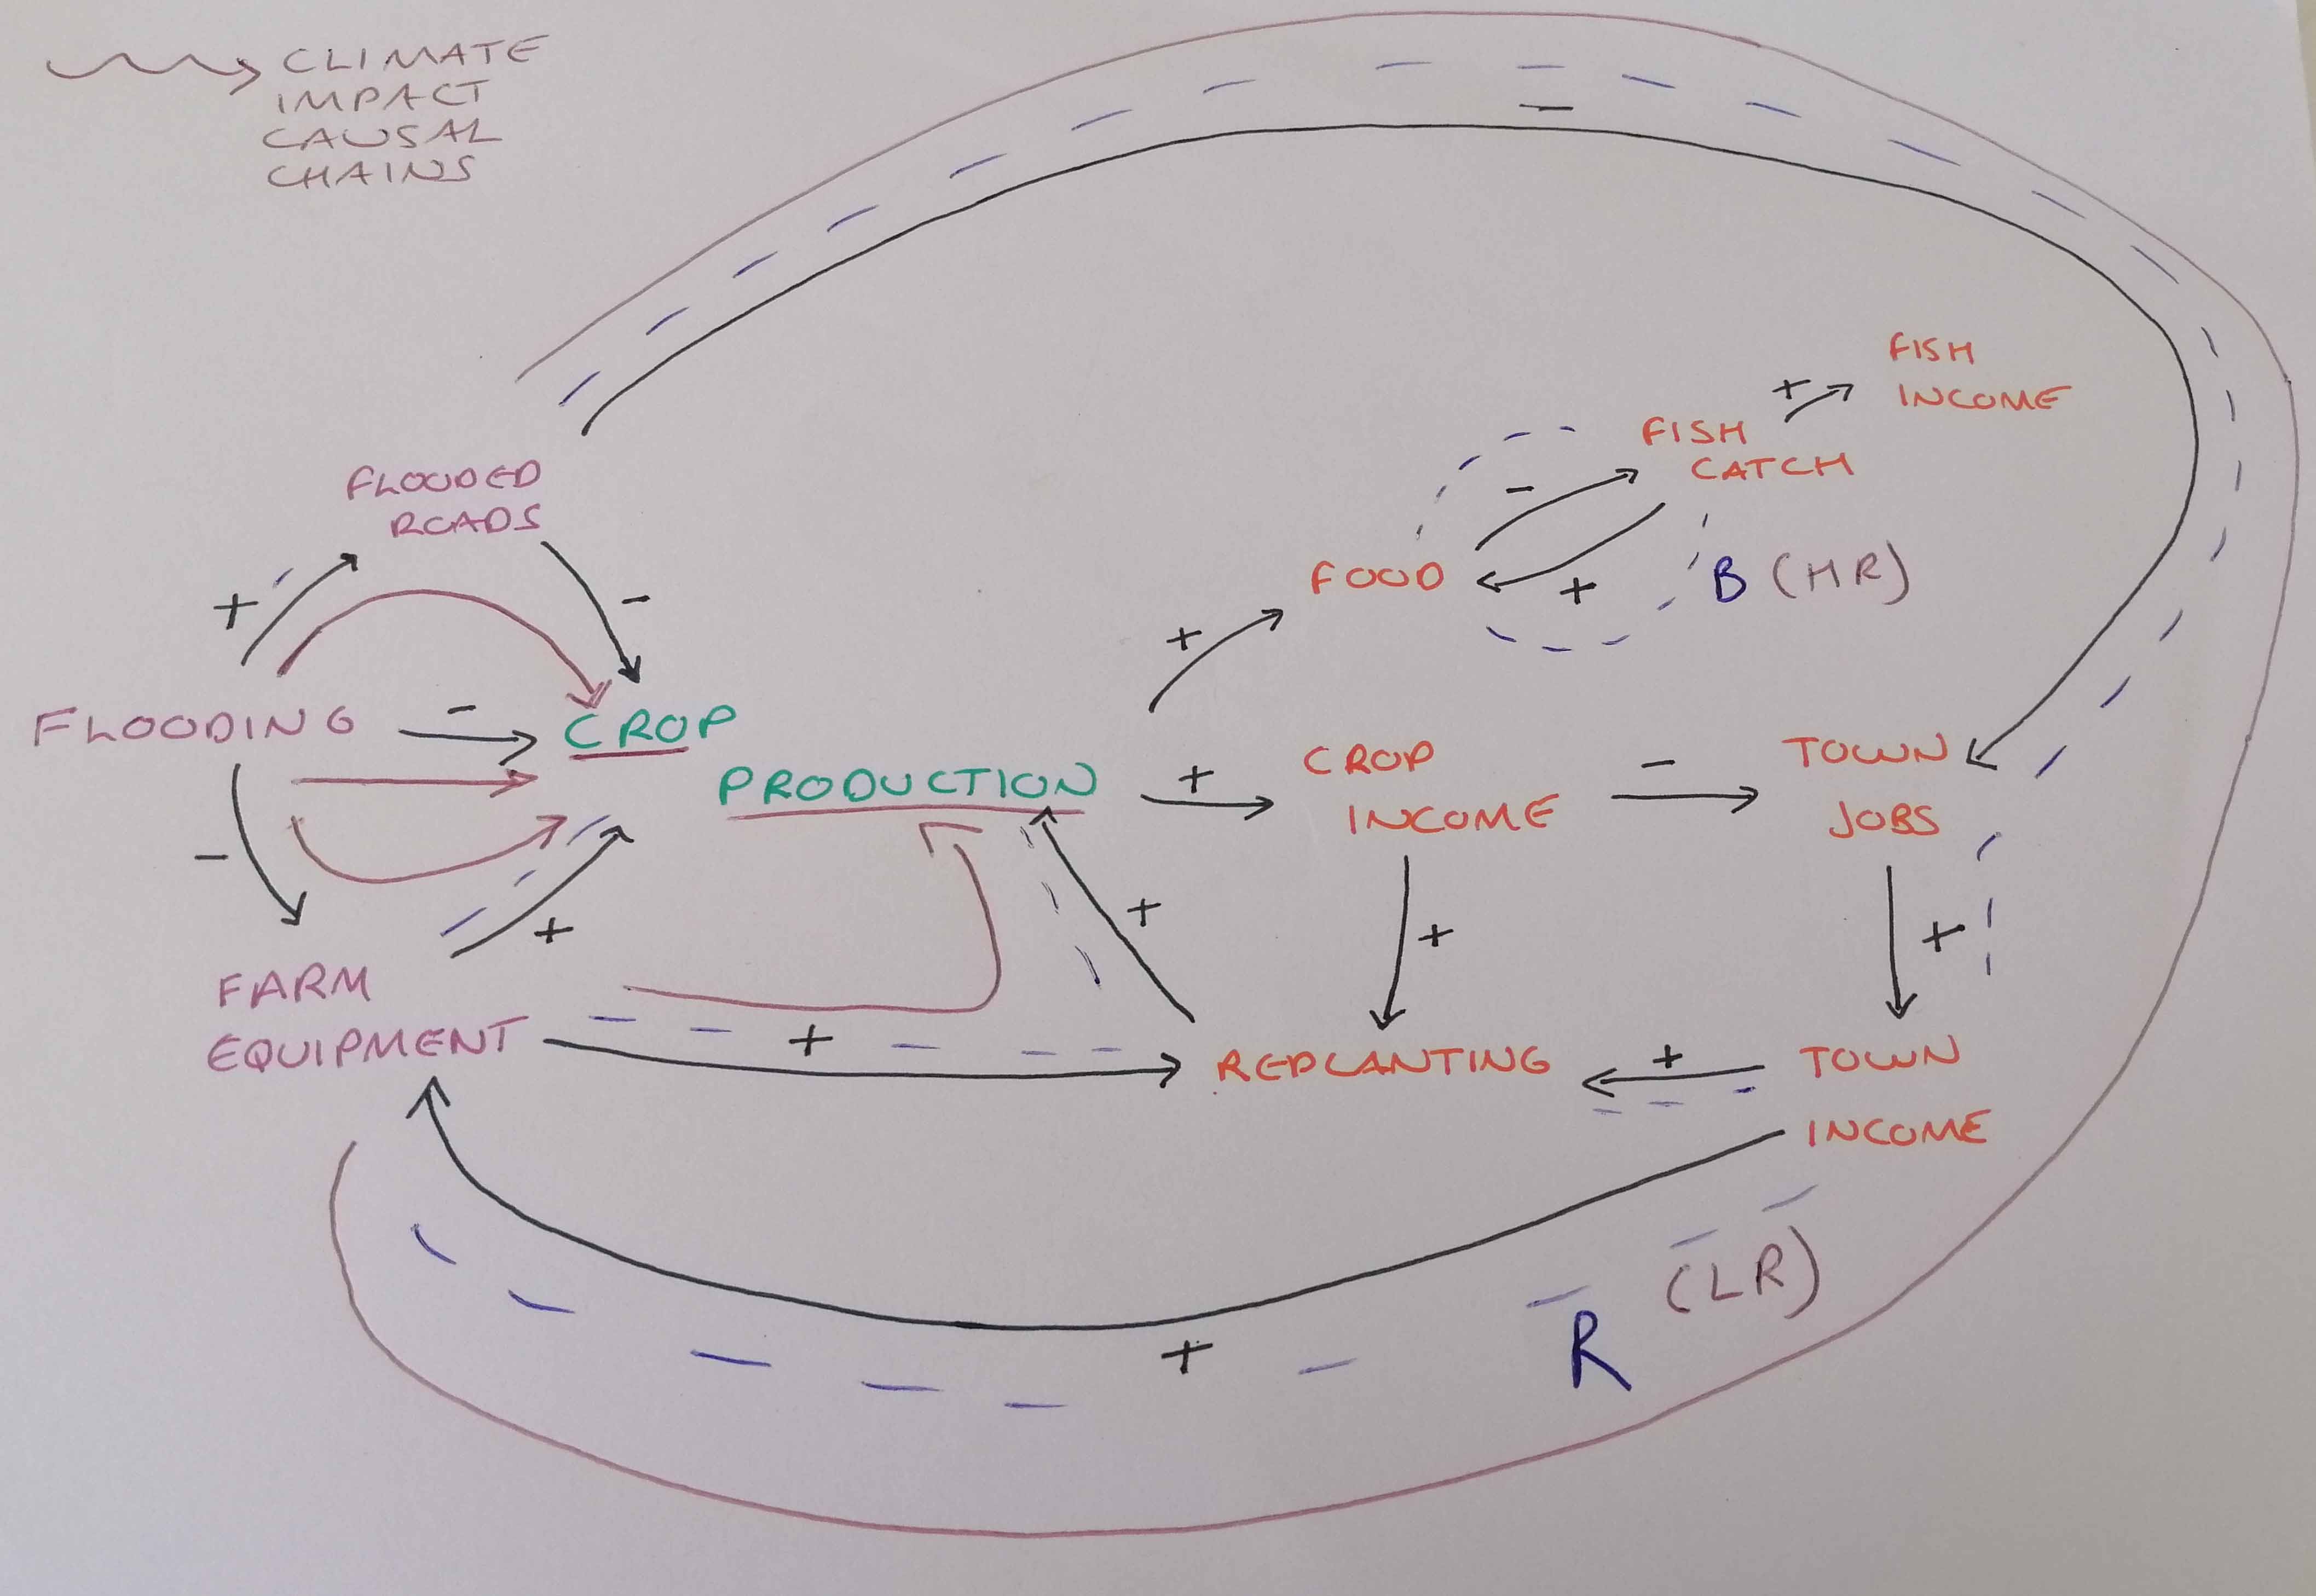
We have traced in red ink the causal chains describing how climate shocks impact crop production and labelled the feedback loops as low-resilience or high-resilience.
TASK 8: Identify response and coping strategies
Let’s consider the role of human activities in responding to climate shocks affecting your problem variable. Look at the direct and indirect consequences on your causal loop diagram.
- Identify all the human activities that are a response to climate shocks affecting your problem variable. These can be a mix of measures taken to try and recover flows of ecosystem services related to your problem variable (e.g. replanting crops), using other landscape resources to generate ecosystem services (e.g. a switch from farming to fishing), or seeking out non-landscape sources of income (e.g. remittances from family members overseas).
- How successful do you think these human response activities are at protecting livelihoods? After the response to the climate shock are people’s livelihoods negatively impacted (e.g. less food, income, savings), stable (e.g. they’ve found ways to maintain similar levels of food and income as before the climate shock(, or improved (e.g. in responding to the climate shock they’ve boosed income or food supply).
- Are the human responses to the climate event short-term or long-term responses? Label each human response short-term (ST) or long-term (LT) on your diagram.
- Are any of the human response activities part of feedback loops? Are these feedback loops undermining the system’s capacity to provide ecosystem services that are important for livelihoods or are they contributing to the system recovering after the climate shock to maintain levels of ecosystem service flows? Label any feedback loops undermining system resilience as negative (N)
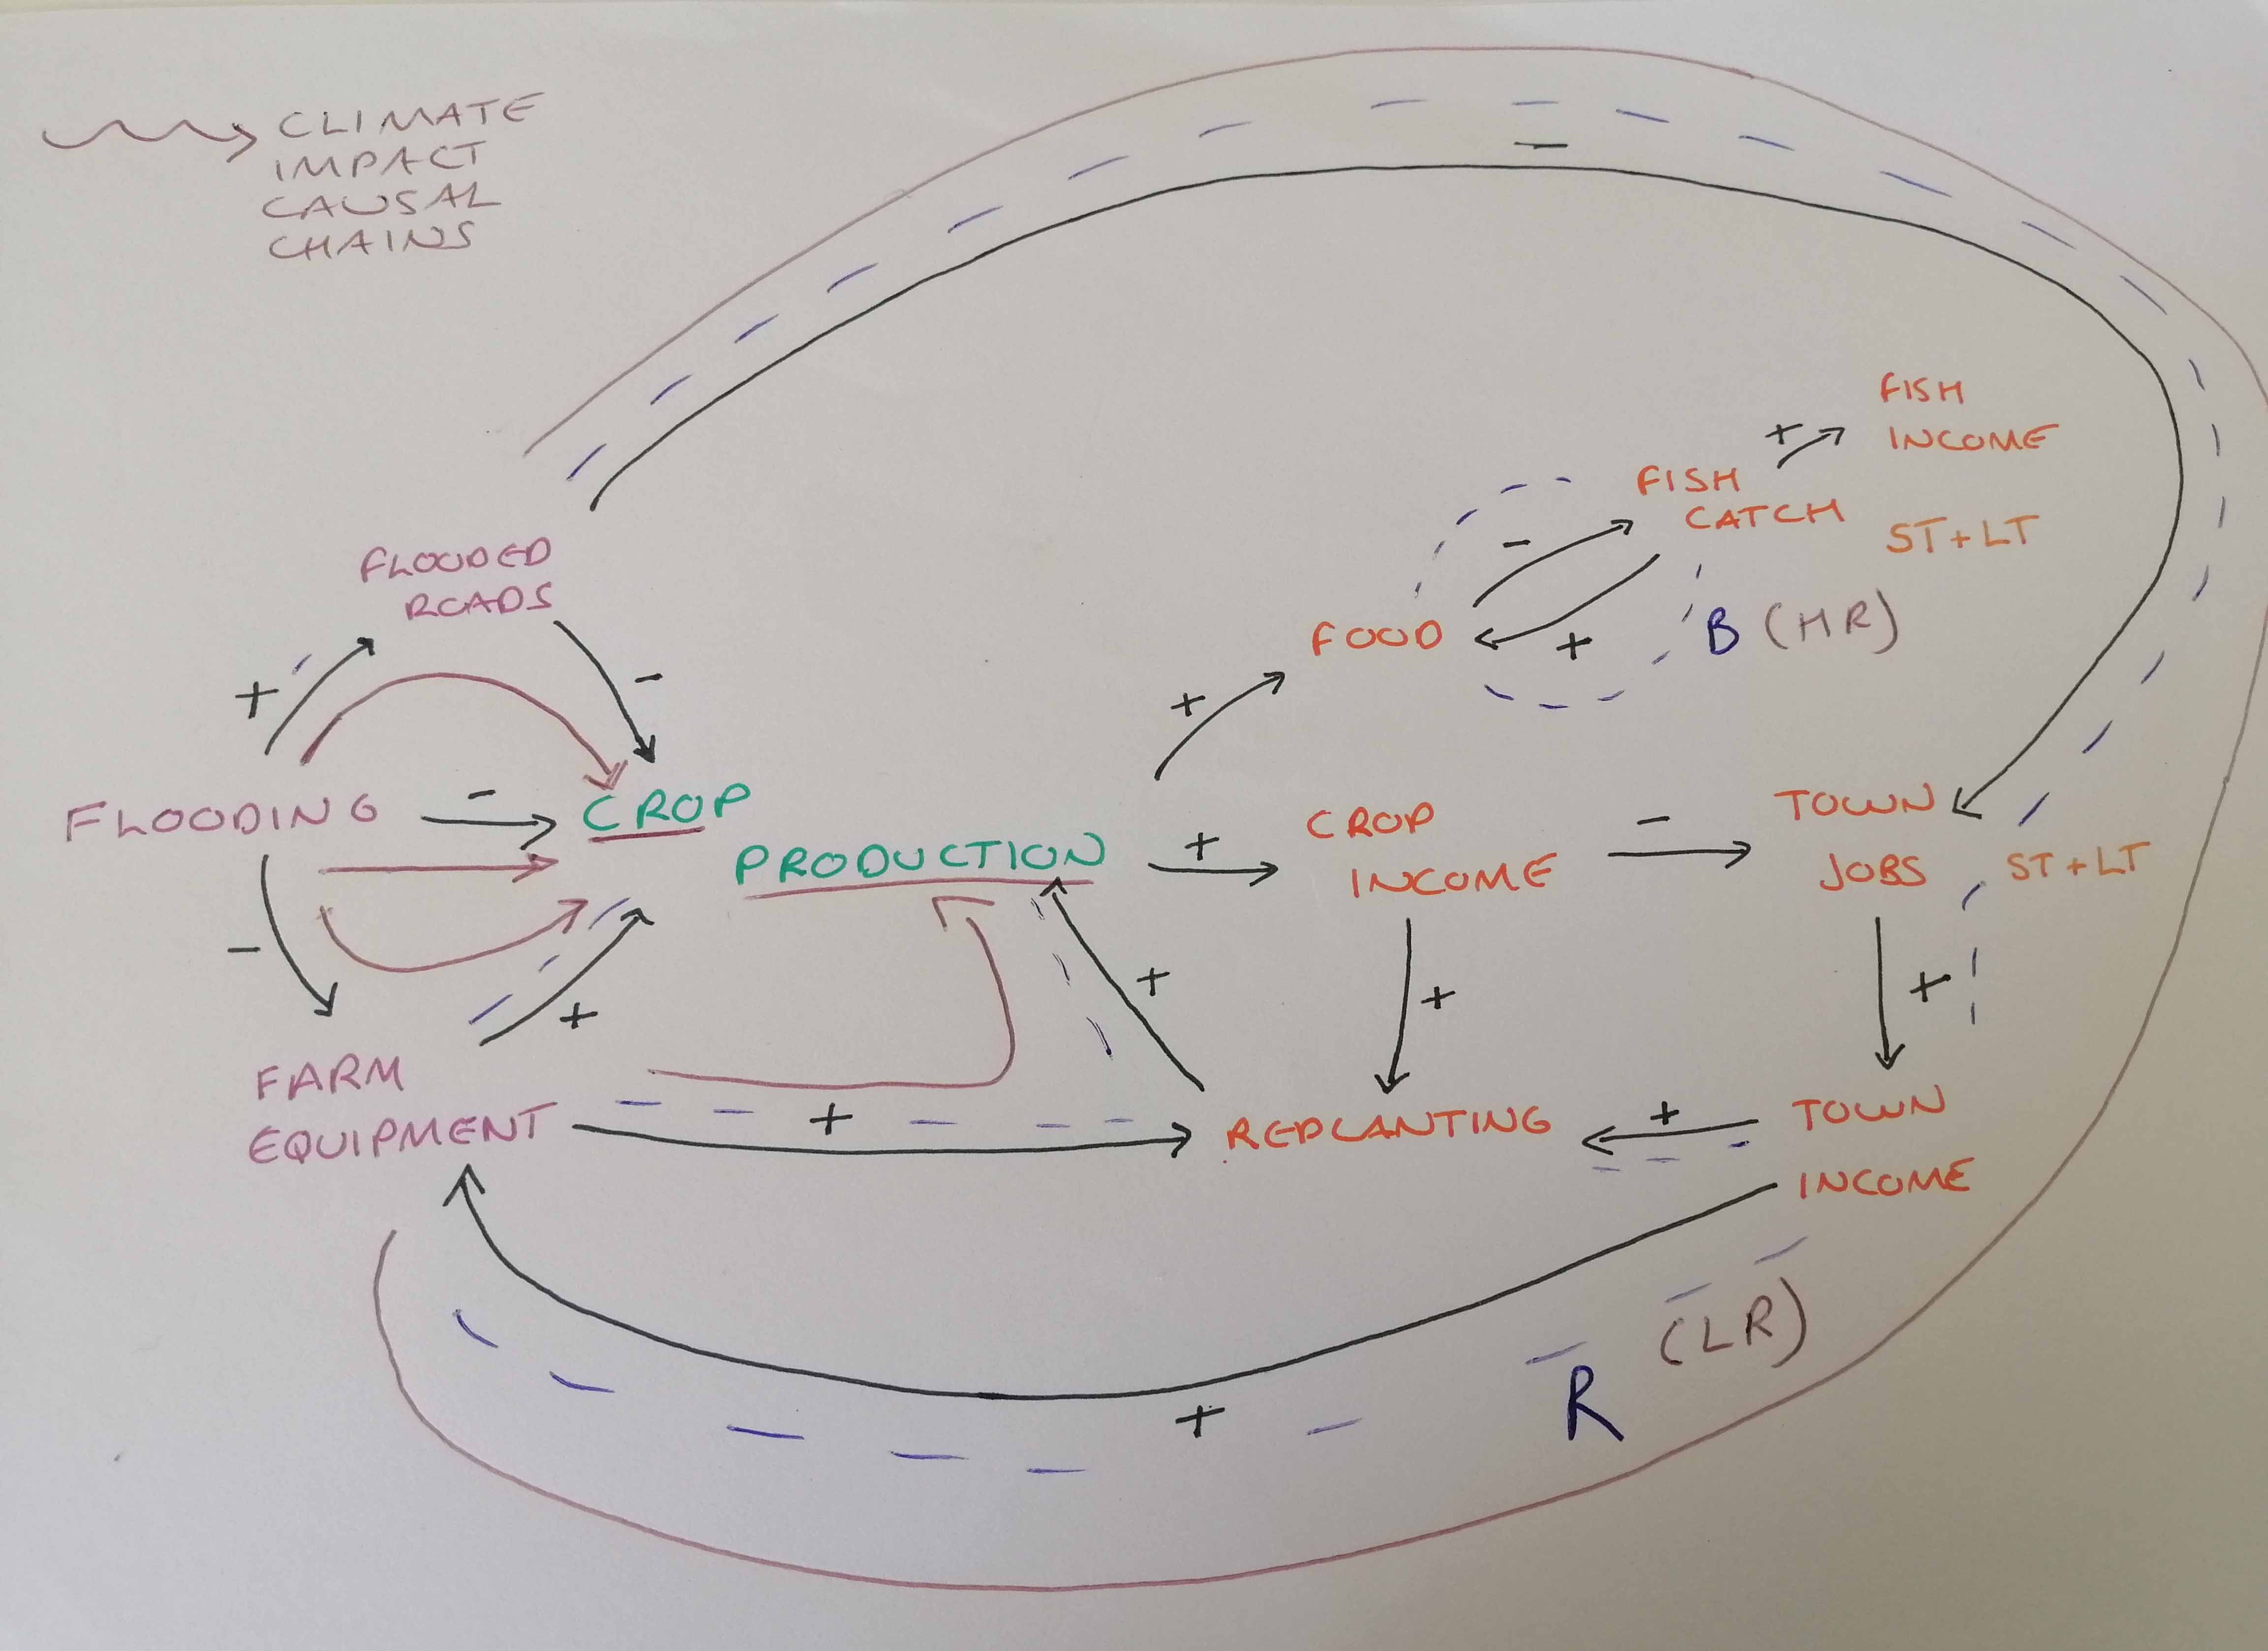
We've labelled fish catch and town jobs as both short- and long-term response activities as people could use these activities for a short period of time or the flood event could be a trigger to a more permanent shift in the mix of livelihood activities.
We wouldn't label any of the human response activities as being negative and undermining the ability of the system to recover levels of crop production. In fact, the ability to use fishing or work in-town to compensate for shortfalls in crop production could be an indicator of a resilient system.
TASK 9: Design an adaptation strategy or policy to increase resilience
In this final task you will use your causal loop diagram to design a policy or adaptation strategy that will increase system resilience to climate shocks. The goal is for your policy or strategy to create a feedback loop that does one or more of the following:
- enables the problem variable, or ecosystem service flows from the problem variable if it is a landscape resource, to quickly recover after a climate shock
- supports people in maintaining their livelihoods through transitioning to use other ecosystem services or livelihood activities that reduce their vulnerability to climate shocks
- does not have any unforeseen impacts such as amplifying or creating negative feedback loops that undermine other aspects of someone’s livelihood system, landscpae resources, or other people’s livelihoods
The goal of this exercise is to demonstrate how causal loop diagrams can help develop adaptation strategies that increase the resilience of socio-ecological systems that support livelihoods. Don’t worry too much about selecting a policy or strategy that is a perfect fit for the Ba Mangrove region. Instead, focus on testing out developing feedback loops for a few different ideas to get a sense for how a goal of adaptation strategy design is to maintain or enhance system functioning (provision of ecosystem services) in the face of climate shocks to support livelihoods.
Use a pencil to sketch different adaptation responses on your diagram and trace the effect of the intervention propagating through the system to check it doesn’t have any unforeseen adverse impacts and that the mechanism through which it boosts resilience is plausible.
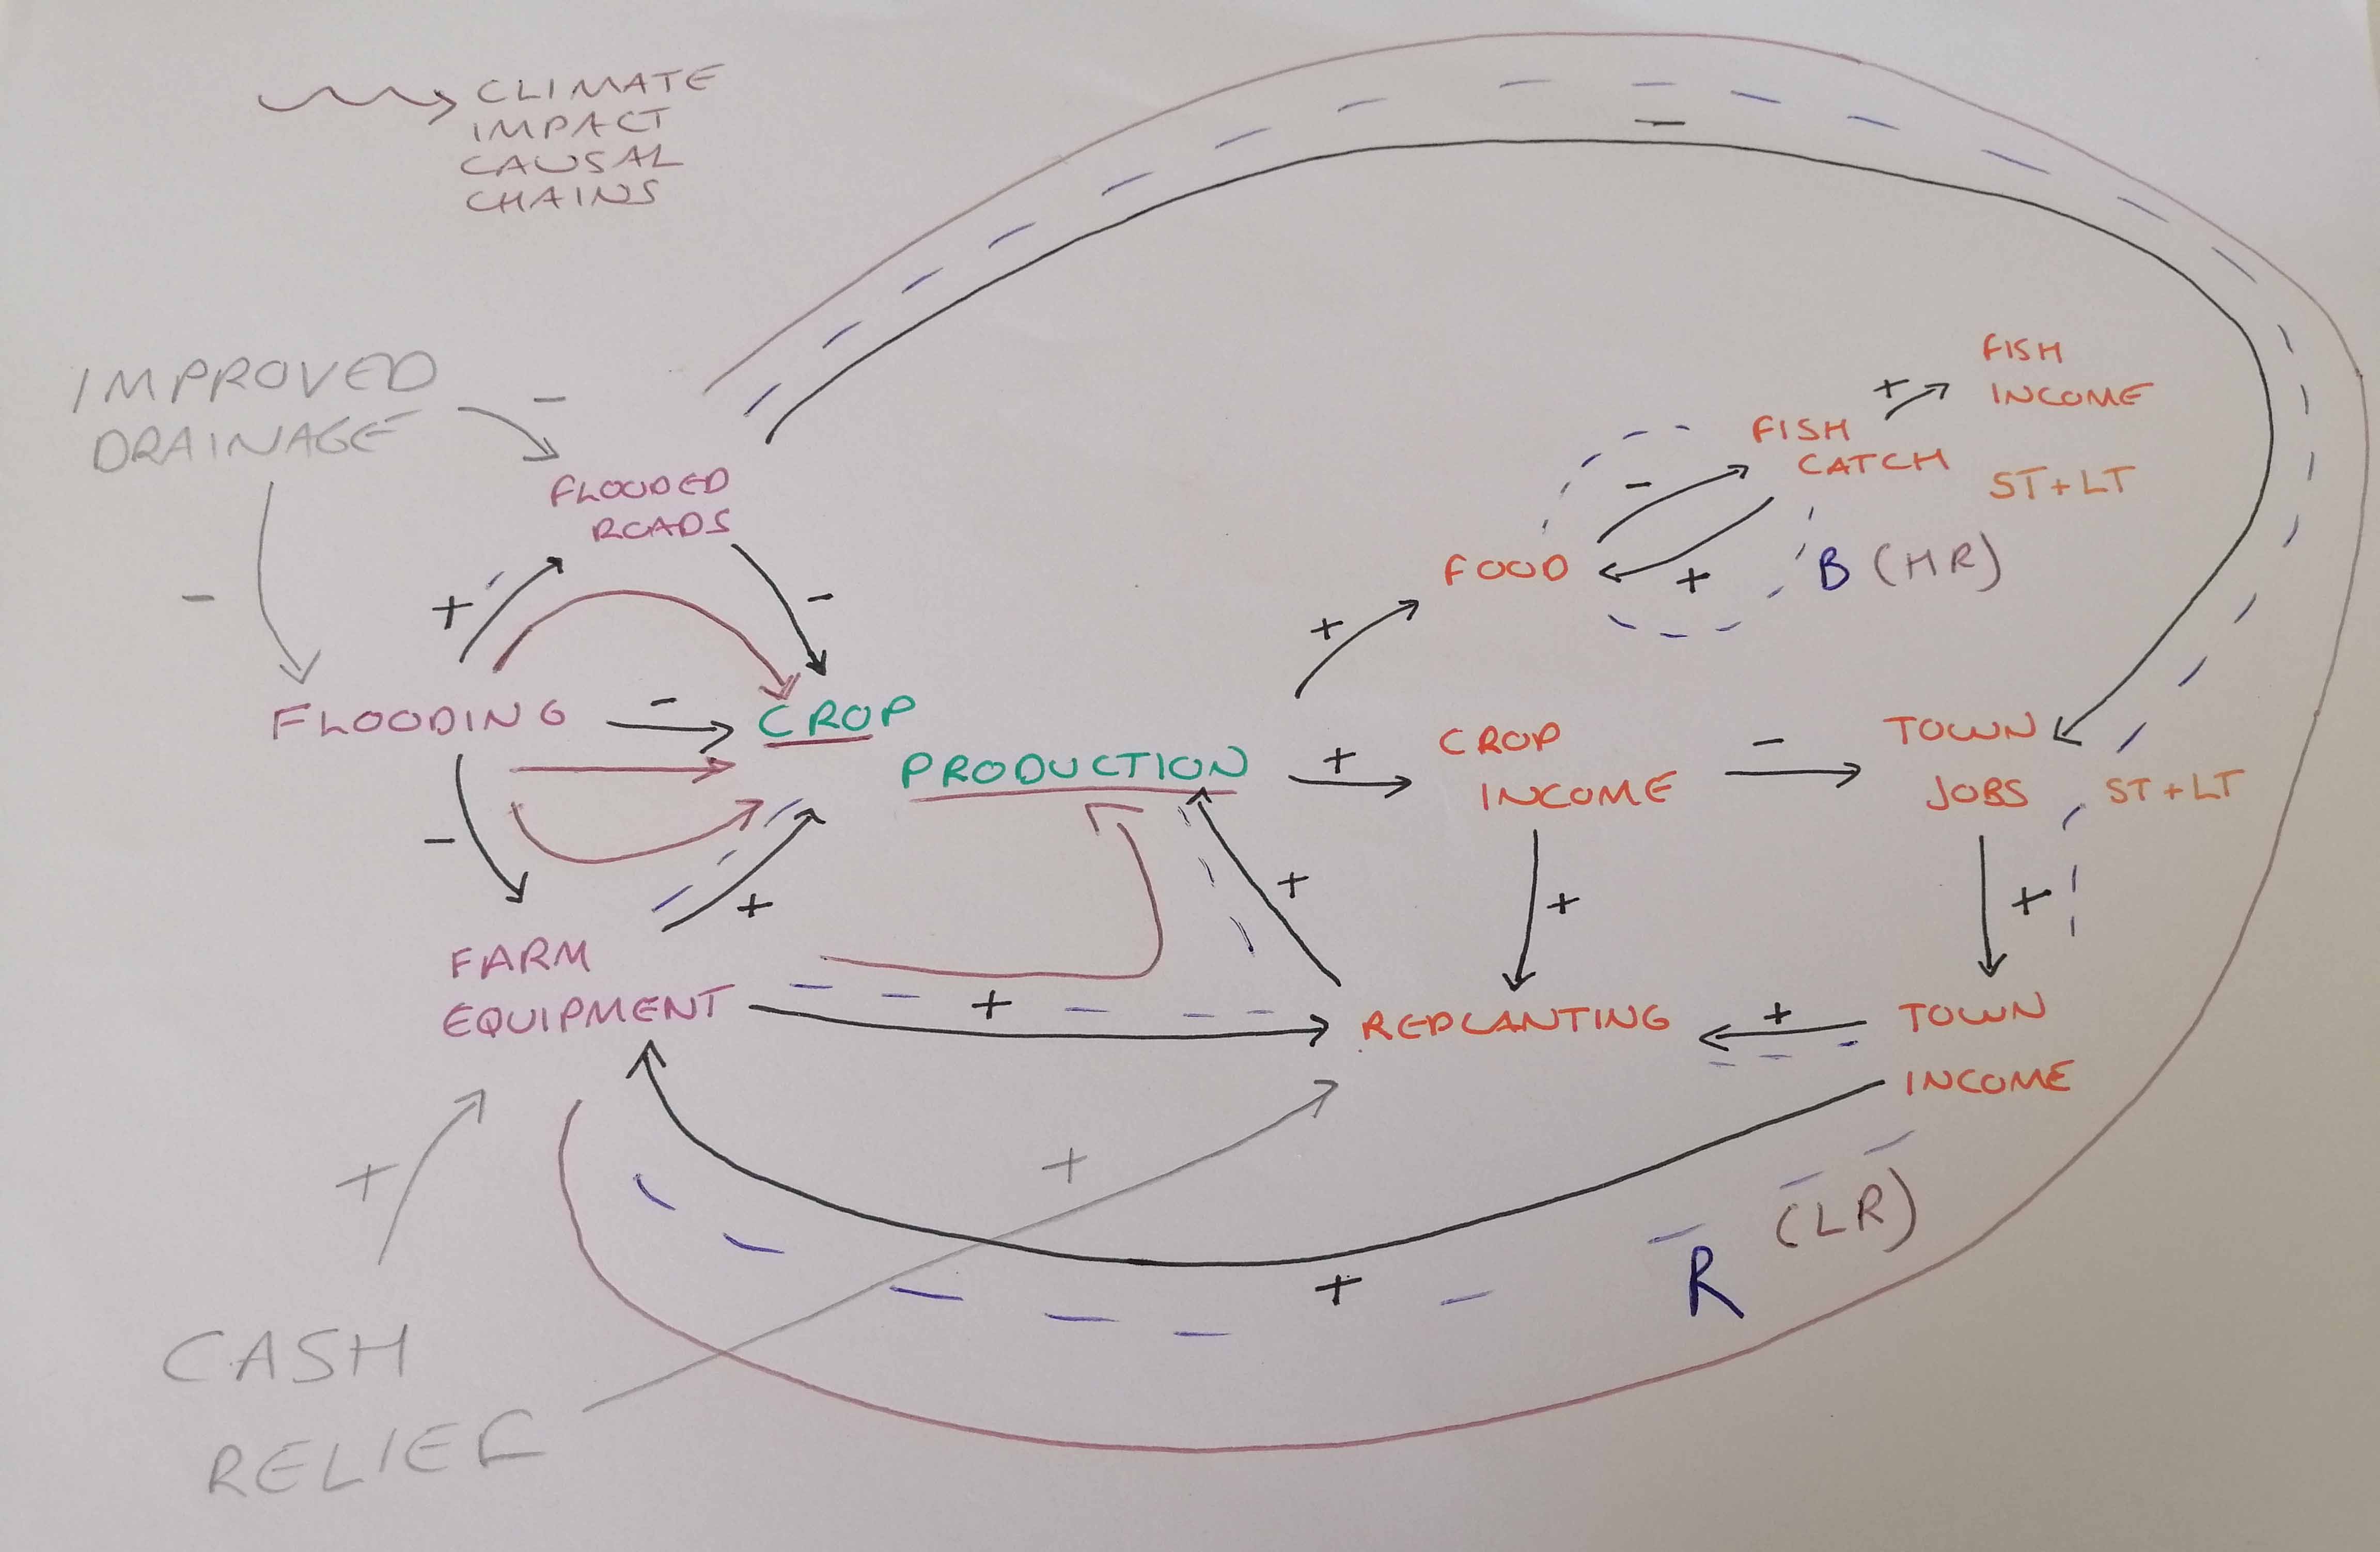
We've added two interventions to disrupt the low-resilience feedback loop: cash relief to farmers to buy equipment and resources for replanting and improving drainage to reduce floods blocking roads.