Introduction to Geospatial Data
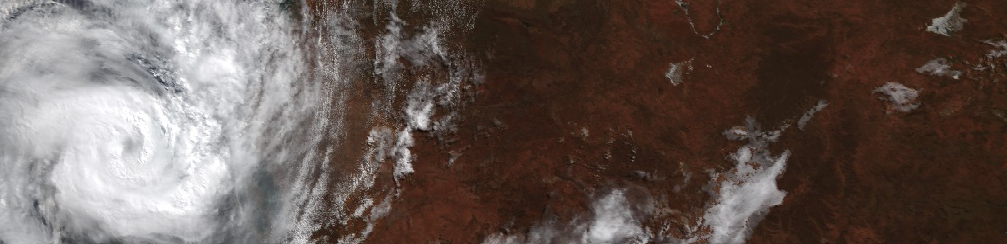
This workshop will provide an introduction to geospatial data. It will focus on satellite images including how they are captured and how they can be used to monitor changes on the Earth’s surface. The workshop will conclude by demonstrating a workflow using satellite images to detect buildings that were damaged by Tropical Cyclone Seroja in Kalbarri, Western Australia.
Activity 1: Geospatial Data
Google Timelapse presents a video-like visualisation of images of the Earth captured by satellites from 1984 to the present day.
Head to Google Timelapse to visualise change in conditions on the Earth’s surface over time using satellite images.
Tasks:
- Search for Joondalup to visualise urban development in North Perth since 1984.
- Explore case studies in the sidebar.
- Use the search tool to explore how other locations have changed since 1984.
Consider what is driving the changes in land use and land cover that you can see. Also, consider the consequences of the change you can see for the environment, people, and economies.
As you’re exploring geospatial data in Google Timelapse, note down ideas and suggestions that explain Why is geospatial data valuable and how can it be used?
Activity 2: Characteristics of Geospatial Data
For each of the following geospatial datasets, identify their spatial, temporal, and thematic resolution.
Suggest a potential application or use for each dataset.
Activity 3: Satellite Images
Sketch spectral signatures for the following land cover classes:
- Buildings
- Grass
- Trees
- Roads
- Bare earth
- Water
- Sand
Clicking the following buttons will open Google Earth Engine apps that will let you click on a map to generate spectral signature charts for the clicked location. If you click on a tree, a spectral signature chart illustrating the reflectance of light in blue, green, red, and near infrared wavelengths off the tree will be generated.
You can explore generating spectral signatures with Sentinel-2 (10 m spatial resolution) and Planet (3 m spatial resolution). See if the spectral signatures for different land cover types are similar across teh datasets. Would you expect them to be?
Sentinel-2 Spectral Signature Explorer
Planet Spectral Signature Explorer
Activity 4: Building Damage in Kalbarri
Design a workflow to detect damaged buildings following Tropical Cyclone Seroja using satellite images.
Use the following Google Earth Engine apps which let you visualise Sentinel-2 and Planet images before and after Tropcial Cyclone Seroja impacted Kalbarri to see if you can spot the signature of building damage in the images. Can you think of a way to automatically detect damaged buildings from these images?
As you’re exploring the images in the apps, consider the following questions:
What do we hypothesise the spectral signature of a damaged building / roof to be? How will this differ from an undamaged roof?
What are the characteristics of satellite images that we require for this task (spatial, temporal, and thematic / radiometric resolutions)?
Would Planet or Sentinel-2 data be more suited to detecting damaged buildings? Why?
What time-periods do we need to capture images from to detect damaged buildings?
Spectral signature explorers:
Use the following Google Earth Engine apps to visualise the spectral reflectance profile of image pixels before and after Tropical Cyclone Seroja impacted Kalbarri. Use the high resolution basemap image from Nearmap to identify damaged locations and explore how the reflectance has changed at these locations.
TC Seroja Sentinel-2 Spectral Signature Explorer
TC Seroja Planet Spectral Signature Explorer
Split screen explorers:
Use the following Google Earth Engine apps to visualise before Tropical Cyclone Seroja and after Tropical Cyclone Seroja images of Kalbarri to explore how damaged buildings are represented in satellite images.
TC Seroja Sentinel-2 Split Screen Explorer
TC Seroja Planet Split Screen Explorer
Wrap Up - Change Detection
Open the following app to visualise the results of change detection analysis to identify buildings damaged by Tropical Cyclone Seroja in Kalbarri.