Workbook - Building Damage in Kalbarri
Load Google Earth Engine in your web browser at: https://code.earthengine.google.com
Some key code editor features include:
- Code editor: where you write JavaScript statements.
- Scripts tab: save the JavaScript code for your Google Earth Engine programs.
- Map: web map to visualise spatial data.
- Docs: lists all the in-built functions and operations.
- Console: print results from analysis and metadata.
- Inspector tab: interactive query of spatial objects on the map.
- Geometry tools: digitise vector features to use in your Google Earth Engine programs.
- Run: Run your script.
Working with the GEE Map
We will start the practical exercise by working with the GEE map interface.
Searching for a Place
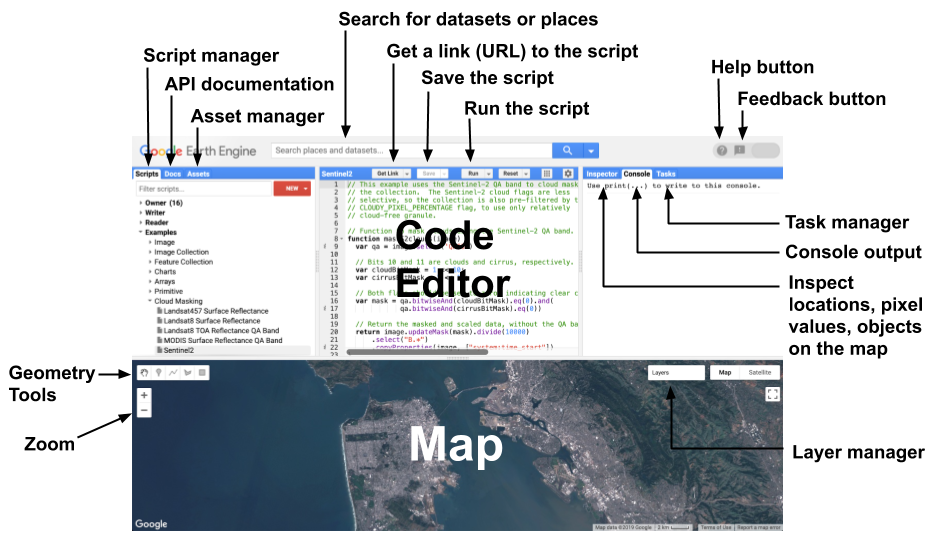
Let’s start by setting the map so that it shows the Kalbarri, Western Australia. In the Search for places or datasets box at the top of GEE, start typing in Kalbarri and you will see Kalbarri suggested under PLACES. Click on it and the map will centre on the Kalbarri.
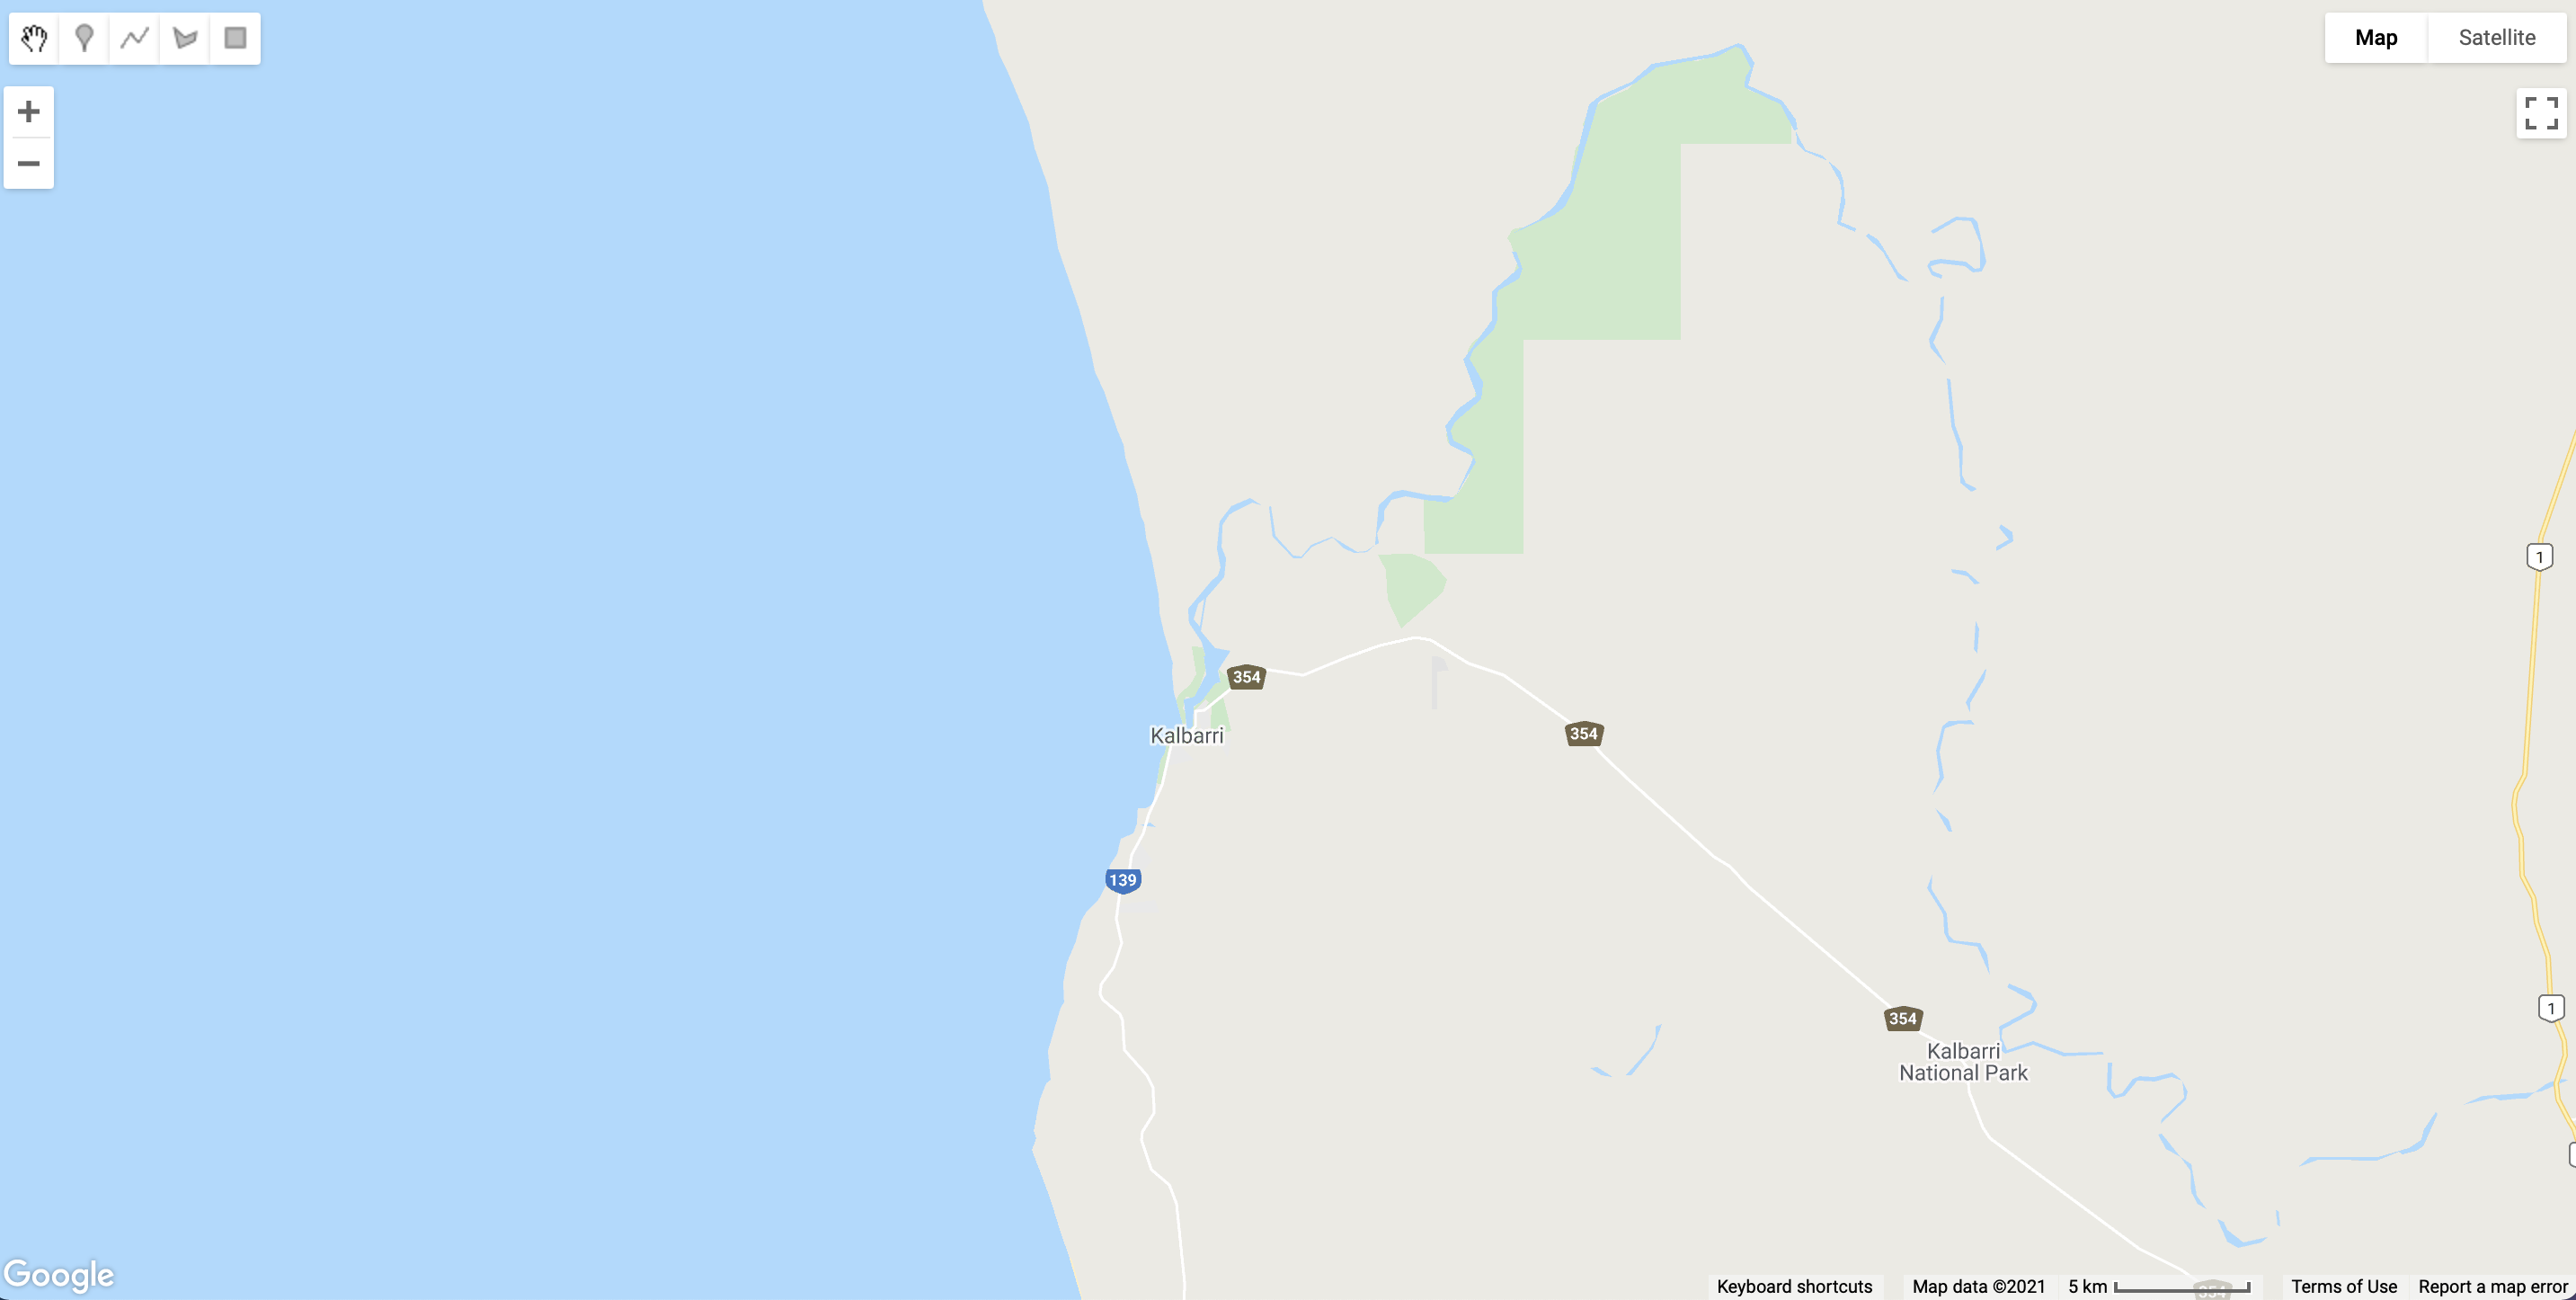
In the upper right of the map display are Map and Satellite buttons. This changes the basemap from Google Maps style to a satellite image. Click on Satellite to change the basemap.
You can use the Zoom tool in the map window to zoom in and out, and click and drag the map to change the view. However, we want to set the location and zoom level in our script so the map will always be placed at the study area when we run the script.
Zoom
// 1. set the zoom
// Change the argument to setZoom to illustrate how you can programmatically control the Map.
Map.setZoom(12);
Before you continue any further, let’s save the script. Click the Save button and enter the File Name as tc-seroja-building-damage.js and click OK.
Centre the Map
// 2. Centre the map at a location
// Create a point object.
var kalbarriPoint = ee.Geometry.Point([114.16361565669752, -27.71407018883071]);
// Centre the map on the point object.
Map.centerObject(kalbarriPoint, 12);
Geographic Data - Raster
We need to represent geographic features and phenomenon as data in our programs. Geographic data comprises:
- locational / positional information.
- attribute / non-spatial information.
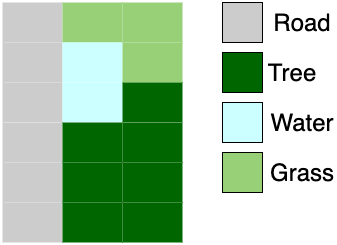
Raster data - pixels / grid cells. Vector data - geometric objects (points, lines, polygons).
Images
An Image comprises one or more bands of raster objects.
// 3. Images
// Load a Planet Scope 4 Image.
// Print to the console - explore Image metadata.
var ps4Img = ee.Image("users/jmad1v07/morethanmaps/ps4-median-composite");
print(ps4Img);
We can relate values in Image pixels to colour on the display to visualise features in an Image. This image contains reflectance in red, green, and blue bands so we can map it to the display to create an RGB composite (true colour composite).
// Center the map and zoom in on Kalbarri.
// Rescale raster (Image) data.
// Visualise raster (Image) data.
Map.centerObject(kalbarriPoint, 16);

ps4Img = ps4Img.divide(10000);
var ps4VisParams = {
  'bands': ['b3', 'b2', 'b1'],
  'min':-0.0198,
  'max':0.2067
};
Map.addLayer(ps4Img, ps4VisParams, 'PS4 Image');
Note the // - this is a comment which is reference text for you. It is not executed in your program.
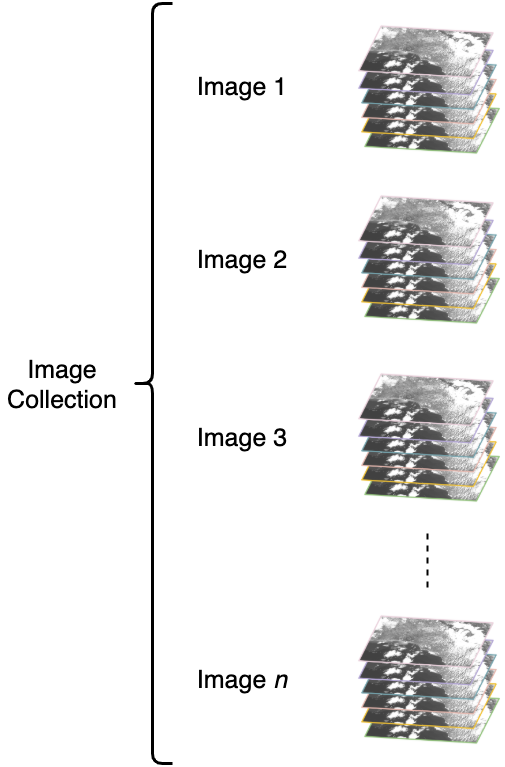
ImageCollections
An ImageCollection is a stack of Images.
ImageCollection data structure in Google Earth Engine (source: Google Earth Engine)//4. ImageCollection - stack of Images.
var ps4ImgColl = ee.ImageCollection('users/jmad1v07/morethanmaps/kalbarri-ps4-tc-seroja');
print(ps4ImgColl);
Operations that can be applied to ImageCollections:
- Filter - select
Images based on a conditions. - Reduce - summerise
Images within anImageCollection. - Mapping - map a function over all
Images within anImageCollection.
Filter an ImageCollection
Selecting Images from an ImageCollection based on a condition.
// 5. Filter Images pre TC Seroja
var ps4PreTCSeroja = ps4ImgColl
    .filterDate('2021-01-01', '2021-04-09');
print('Images pre-TC Seroja:', ps4PreTCSeroja);
Reduce an Image Collection
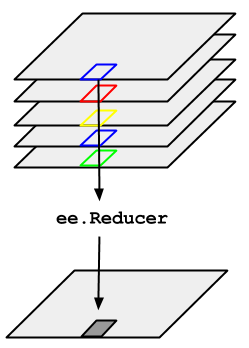
ImageCollection in Google Earth Engine (source: Google Earth Engine).Summarise all Images in the ImageCollection. Here, we take the median value across all Images and pixels in the ImageCollection.
// 6. Reducer
// Median reducer
// divide by 1000 to rescale PS4 image to reflectance
var ps4PreTCSerojaMedian = ps4PreTCSeroja.median().divide(10000);
print('pre-TC Seroja - median Image:', ps4PreTCSerojaMedian);
// Visualise reduced image
// visualise parameters
var medianVisParams = {
  'bands': ['b3', 'b2', 'b1'],
  'min': 0,
  'max': 0.25
};
Map.addLayer(ps4PreTCSerojaMedian, medianVisParams, 'PS4 Image - pre-TC Seroja');
Geographic Data - Vector
Vector data represents geographic features as geometric objects (points, lines, and polygons).
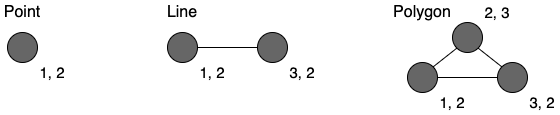
Positional information is represented as coordinates. Non-spatial attribute information is used to describte geographic features associated with coordinates.
Geometry Objects
Geometric features in Google Earth Engine are stored as Geometry objects. The ee.Geometry.Point() function takes an array of coordinates and returns a Point Geometry object.
// 7. Geometry
// Vector data - point
var kalbarriPoint =  ee.Geometry.Point([114.16361565669752, -27.71407018883071]);
print('Kalbarri Point:', kalbarriPoint);
Map.addLayer(kalbarriPoint, {color: 'blue'}, 'Point');
Features
Feature objects in Google Earth Engine combine geographic locations (as Geometry objects) with a Dictionary object of non-spatial attribute information. Dictionary objects store this information in name:value pair format.
// 8. Feature
// Features combine geographic coordinates with a Dictionary object of Feature properties.
var kalbarriFeature = ee.Feature(kalbarriPoint, {name: 'Kalbarri'});
print('Kalbarri Feature:', kalbarriFeature);
FeatureCollections
FeatureCollections store a collection of Features. Similar to ImageCollections there are operations to filter and reduce FeatureCollections. Executing the following code will render a FeatureCollection of building footprints from Microsoft’s Building Footprints layer on the Map display.
// 9. Feature Collection - Building Footprints
var buildingFootprints = ee.FeatureCollection('users/jmad1v07/morethanmaps/microsoft_building_footprints');
print('Building Footprings:', buildingFootprints);
Map.addLayer(buildingFootprints, {}, 'Building Footprints');
Remote Sensing
See the main workshop page for detailed notes on key remote sensing concepts.
Image Bands
Use the inspector tab to explore pixel values for Images displayed on the map. The pixel values are in units of spectral reflectance.
Click at a location on the map and look in the Inspectors tab. Under the PS4 Image - pre-TC Seroja Image you should see four numbers printed against properties labelled b1, b2, b3, and b4. These numbers are the surface reflectance values recorded by the sensor in different wavelengths:
b1: blue visible lightb2: green visible lightb3: red visible lightb4: near-infrared light
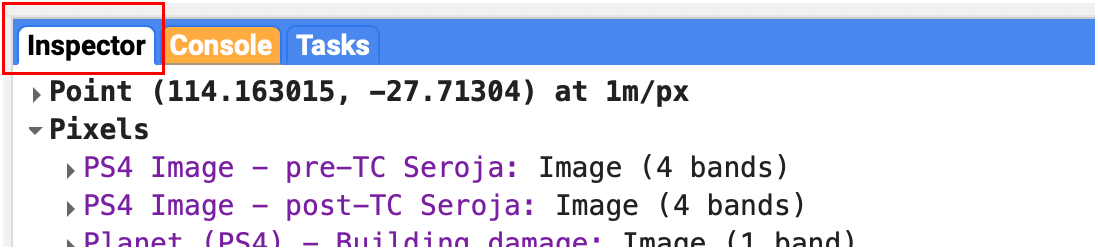
b1, b2, b3, and b4 are the names of Image bands. Surface reflectance values for the same location but different wavelengths are stored in a separate band. Each band is a raster dataset - values are stored in pixels.
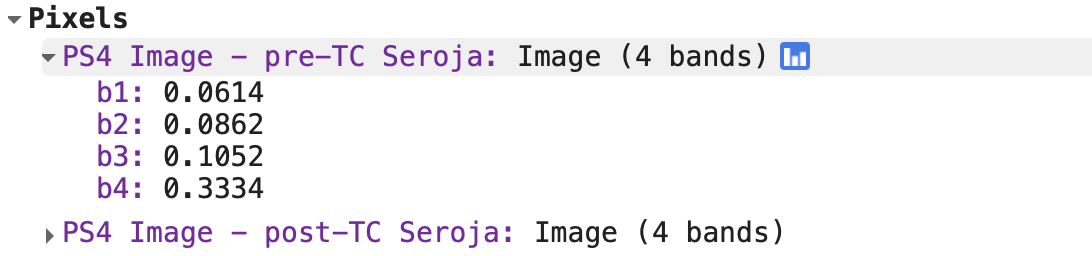
Image.Single Image Band
Visualise surface reflectance values for a single band on the map. Let’s map surface reflectance in the visible blue wavelengths.
// 10. Blue band surface reflectance
var ps4Blue = ps4PreTCSerojaMedian.select('b1');
Map.addLayer(ps4Blue, {min:0, max: 0.4}, 'PS4 Blue Band');
Which objects have the highest reflectance in the blue band, and why?
House roofs appear brightest on the map which indicates they have the highest reflectance values. This makes sense, roofs are typically smooth shiny surfaces that will reflect incoming sunlight.
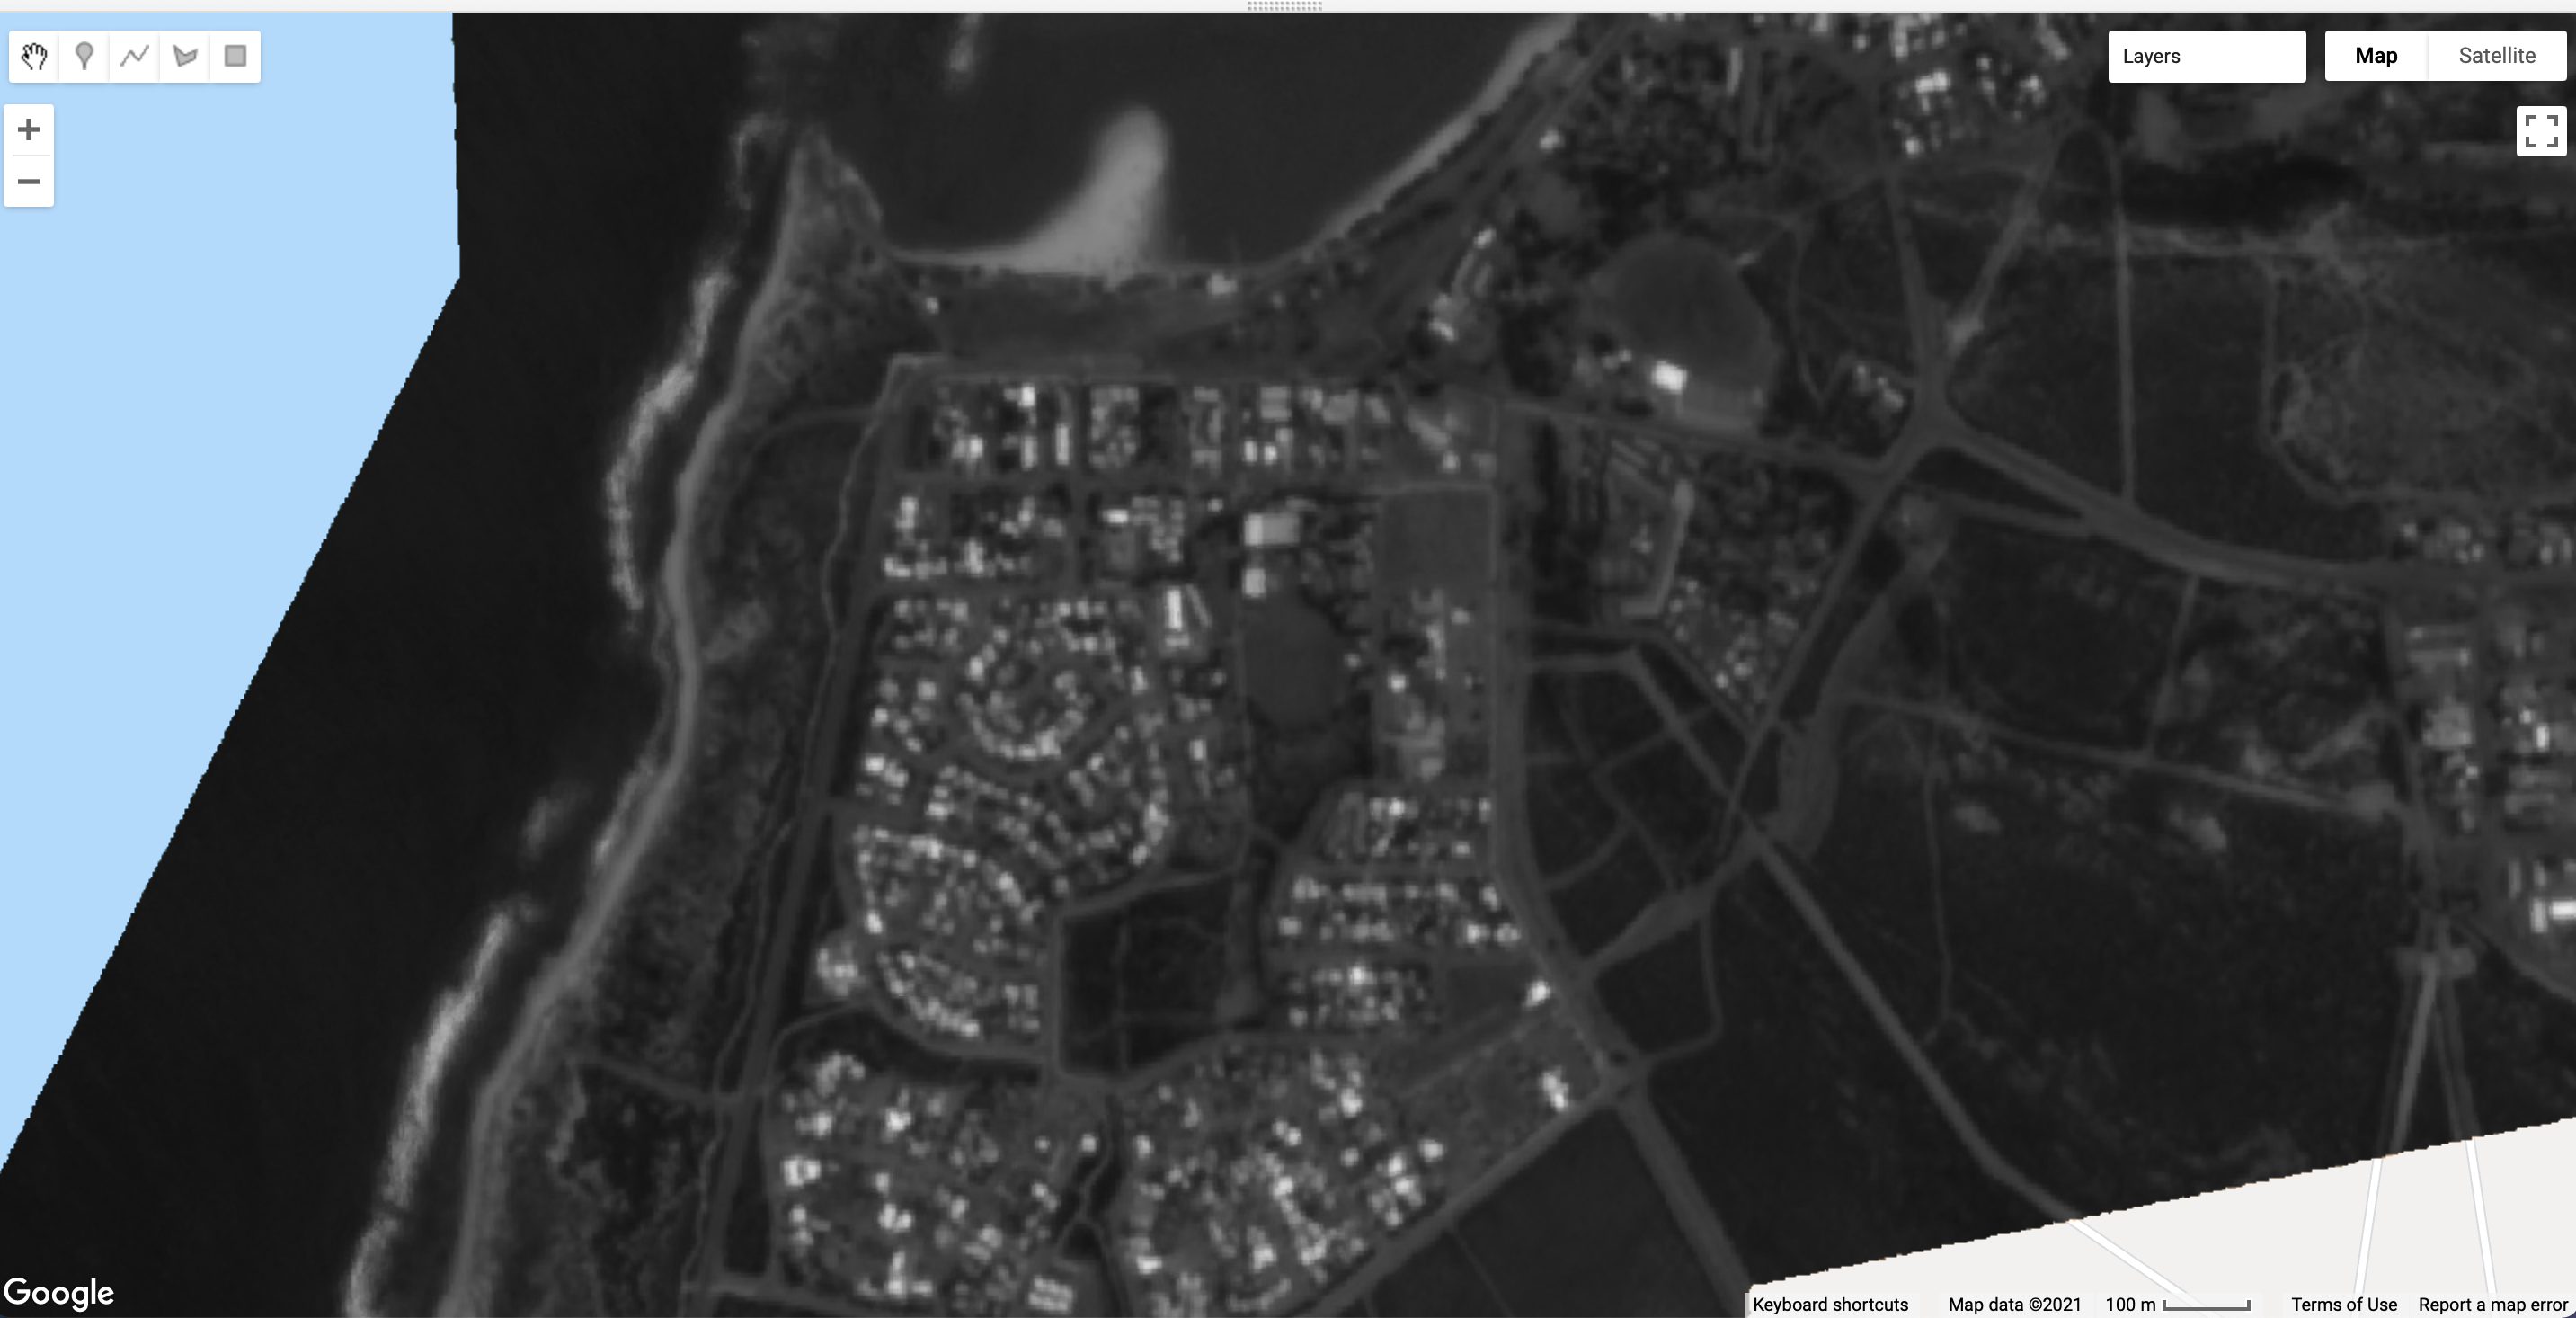
Image.As mentioned above, different surfaces have different levels of reflectance at different wavelengths. In other words, different surface objects have different spectral reflectance characteristics which we can use to distinguish objects or features in a satellite image.
Use the Layers selector to bring the image PS4 Image - pre-TC Seroja onto the map display. Then head to the Inspector tab, click on a water pixel, and then click on the chart symbol next to the layer name. This will allow you visualise pixel values in a bar chart.
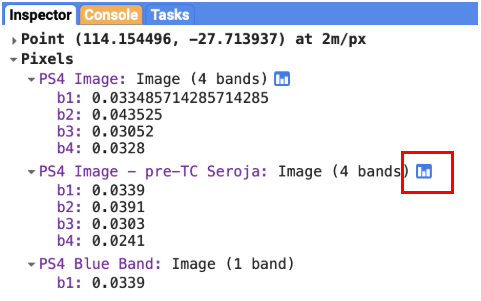
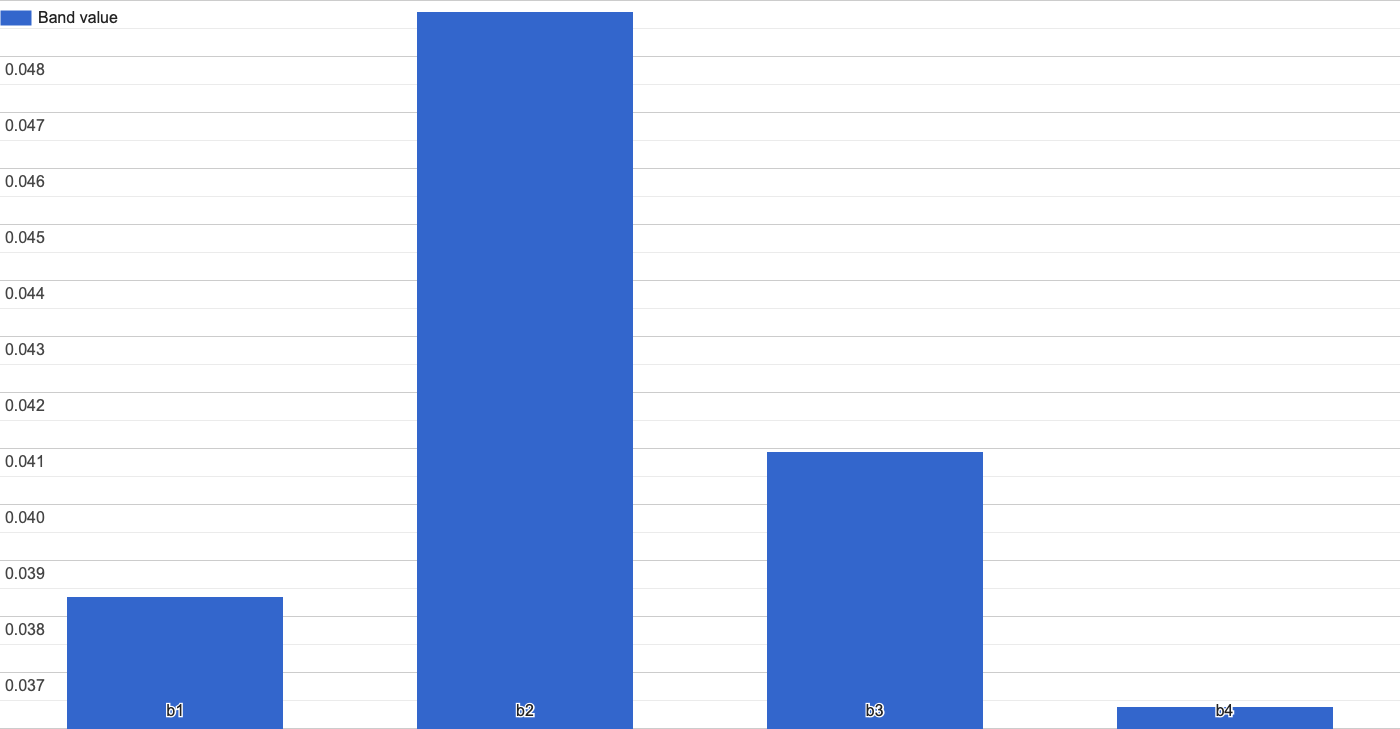
Image.Click on pixels of different surface cover types such as buildings, roads, and vegetation.
Can you spot common patterns in the spectral reflectance of pixels of different cover types?
- Water absorbs incoming solar radiation and has low levels of reflectance. Water is particularly absorbant in near-infrared wavelengths.
- Green vegetation has high levels of reflectance in the near-infrared band (band 4) compared to the visible wavelengths.
- Building roofs have higher levels of surface reflectance in all wavelengths as they are smooth reflective surfaces.
- Bare earth areas have lower levels of reflectance than shiny roofs, and in the visible bands there is more reflectance in the red band (band 3). This is why the bare earth has a reddish colour.
Mapping Building Damage
Now we will use the data and skills learned so far to develop a program that can map building damage following Tropical Cyclone Seroja from satellite images.
Display a high spatial resolution Nearmap aerial Image after Tropical Cyclone Seroja struck Kalbarri to see where building damage occurred.
// 11. High-resolution Nearmap image
var nmKalbarriSeroja = ee.Image("users/jmad1v07/morethanmaps/kalbarri-nearmap-tcseroja");
print(nmKalbarriSeroja);
Map.addLayer(nmKalbarriSeroja, {}, 'Nearmap post-TC Seroja');
How do you think the surface reflectance of a roof will change if it has been damaged during Tropical Cyclone Seroja?
We might expect there to be a decrease in surface reflectance compared to it's pre-damaged state. The cyclone damage will make the roof surface rougher, incoming solar radiation will be reflected equally in all directions with less energy being directly reflected to the satellite-sensor. This will be our working hypothesis. We'll expect that damaged roofs will show a decrease in surface reflectance compared to their pre-damaged state and undamaged roofs will have similar levels of surface reflectance before and after the storm.
Change Detection - Identifying Damaged Roofs
Change detection is an image analysis technique where two images of the same location, but captured on different dates, are compared to identify change in surface reflectance which can be related to actual change on the Earth’s surface.
First, we need to create a post-Tropical Cyclone Seroja Image.
// 12. post TC Seroja
var ps4PostTCSerojaMedian = ps4ImgColl
    .filterDate('2021-04-12', '2021-04-19')
    .median()
    .divide(10000);
Map.addLayer(ps4PostTCSerojaMedian, ps4VisParams, 'PS4 Image - post-TC Seroja');
Then, we can divide the pre-Tropical Cyclone Seroja Image with the post-event Image to create a change map.
// Change building image
var change = ps4PreTCSerojaMedian.divide(ps4PostTCSerojaMedian);
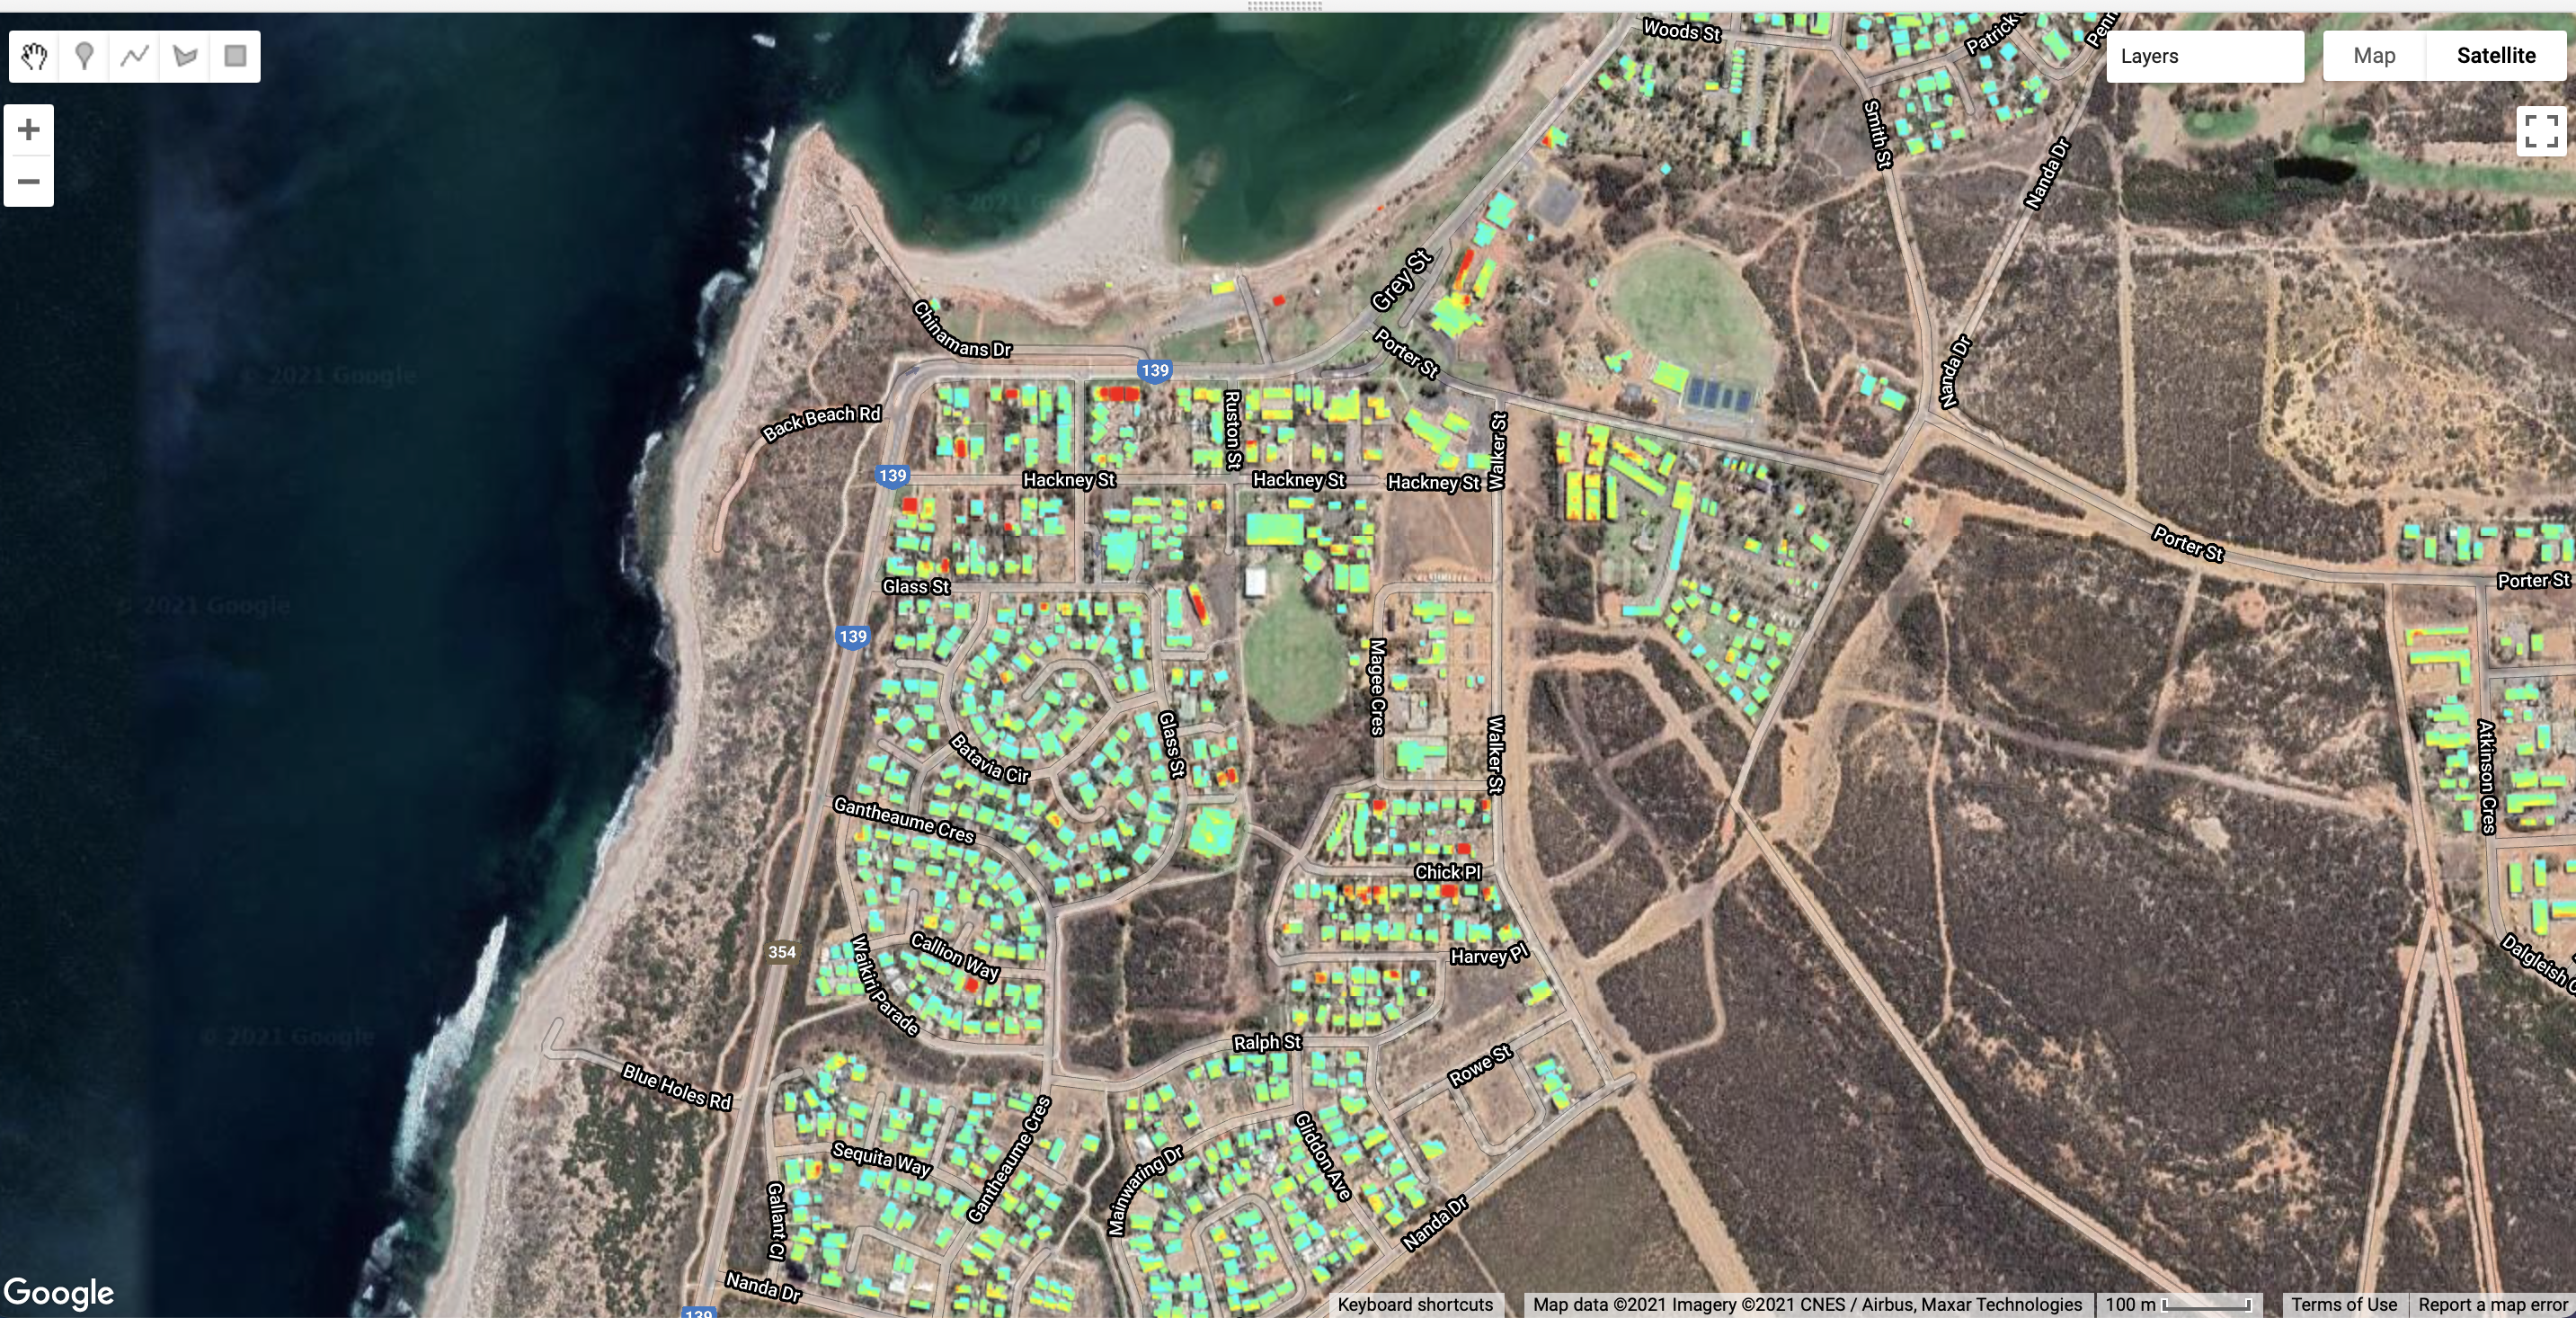
Map.addLayer(change.select('b1'), {min: 0.8, max: 1.4, palette:['00ffff', 'ffff00', 'ff0000']}, 'Change Image');
You should see a similar Image to the below figure on your map display. Areas in red correspond to locations where there is a decrease in surface reflectance in the blue band after Tropical Cyclone Seroja.
Focus on Buildings
We’re only interested in damage to buildings. Let’s clip our change Image to just the building footprint extents to emphasise damage to roofs.
// 13. builing damage
var buildingDamage = change.clip(buildingFootprints);
Map.addLayer(buildingDamage.select('b1'), {min: 0.8, max: 1.4, palette:['00ffff', 'ffff00', 'ff0000']}, 'Building Damage');
Turn off all layers except the Building Damage layer and the Nearmap post-TC Seroja layer. Compare the areas in red shades, which indicate a decrease in surface reflectance, to the high-resolution Nearmap Image. Do the areas with decreased surface reflectance correspond to buildings with damaged roofs?
Images with Google satellite basemap shown for context. (Google Earth: Imagery ©2021 Maxar Technologies, CNES / Airbus, Map data ©2021).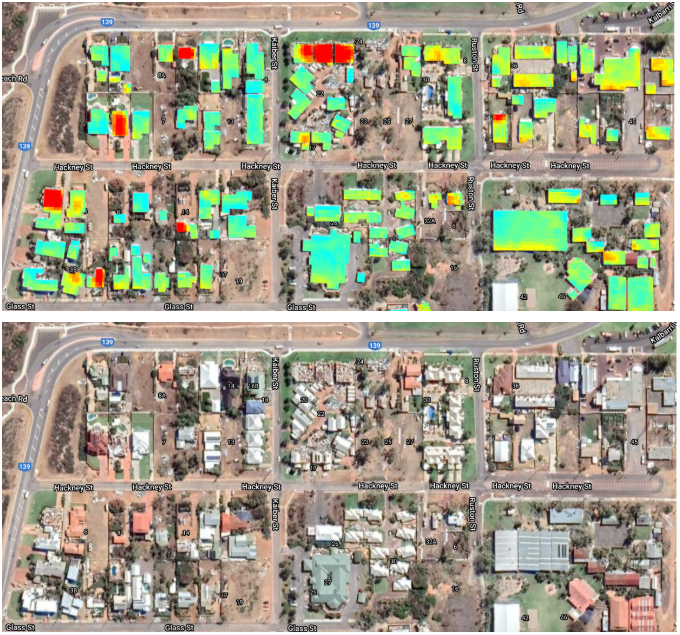
Images with Google satellite basemap shown for context. (Google Earth: Imagery ©2021 Maxar Technologies, CNES / Airbus, Map data ©2021).Mapping Roof Texture - Identifying Damaged Roofs
Can we identify damaged roofs when we only have a post-event Image. This is often the case if an Image is tasked after an event has occurred.
Let’s see if we can create a map of roof texture or roughness and see if that corresponds to sites of damage.
Clip the high resolution Nearmap Image to the building extents.
// 14. High-resolution roofs
var highResRoof = nmKalbarriSeroja.clip(buildingFootprints);
Map.addLayer(highResRoof, {}, 'Nearmap - high-res roofs');
Create a roof texture Image
This will convert the Nearmap RGB Image into a texture Image using the red bands. Higher values will indicate a rougher surface.
// 15. Compute roof roughness
var square = ee.Kernel.square({radius: 4});
var roofTexture = highResRoof.entropy(square).reproject('EPSG:32750', null, 0.5);
Map.addLayer(roofTexture.select('b3'), {min: 3, max: 4.5, palette:['00ffff', 'ffff00', 'ff0000']}, 'Nearmap - roof texture');
Explore the roof roughness Image on the map display and see if you can spot patterns between roof texture and building damage.
Can you identify any strengths or weaknesses of detecting building damage using a single high-resolution Image compared to pre- and post-Image change detection?
The finer spatial resolution pixels of the Nearmap Image means that small-scale damage to roofs can be detected which might not be captured in the coarse spatial resolution Planet Scope 4 Images. However, features on roofs such as solar panels create a rough texture which could be conflated with building damage. If the solar panels were not affected by the cyclone, then roof damage detection using pre- and post-cyclone images for change detection should not be affected be complex roofs.